| Red | Green | Blue | |
| z | 17.64 | ||
| znorm | Inf | ||
| sky | -Inf | -Inf | -Inf |
| S/N | 34.1 | 57.0 | 66.1 |
| S/N(c) | 0.0 | 0.0 | 0.0 |
| SN(E/C) |
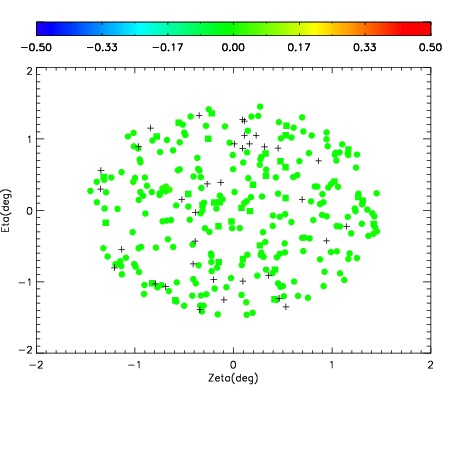
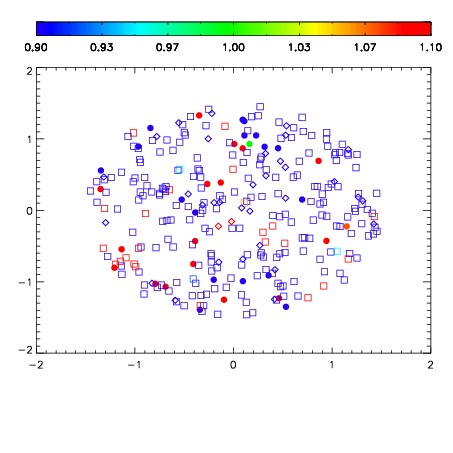
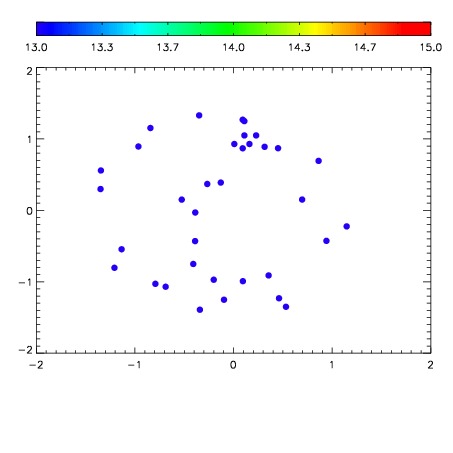

| Frame | Nreads | Zeropoints | Mag plots | Spatial mag deviation | Spatial sky 16325A emission deviations (filled: sky, open: star) | Spatial sky continuum emission | Spatial sky telluric CO2 absorption deviations (filled: H < 10) | |||||||||||||||||||||||
| 0 | 0 |
|
|
|
|
|
|
| IPAIR | NAME | SHIFT | NEWSHIFT | S/N | NAME | SHIFT | NEWSHIFT | S/N |
| 0 | 13820069 | 0.499399 | 0.00000 | 19.0708 | 13820066 | -0.000428214 | 0.499827 | 19.0694 |
| 1 | 13820060 | 0.497844 | 0.00155500 | 19.2231 | 13820059 | 0.00000 | 0.499399 | 19.1861 |
| 2 | 13820061 | 0.498162 | 0.00123700 | 19.1725 | 13820062 | -0.000940938 | 0.500340 | 19.1689 |
| 3 | 13820064 | 0.497384 | 0.00201499 | 19.1555 | 13820070 | 0.000183085 | 0.499216 | 19.1325 |
| 4 | 13820068 | 0.499243 | 0.000156015 | 19.0992 | 13820063 | -0.00117956 | 0.500579 | 19.1315 |
| 5 | 13820065 | 0.497758 | 0.00164101 | 19.0836 | 13820067 | -0.000258612 | 0.499658 | 19.0777 |