| Red | Green | Blue | |
| z | 17.64 | ||
| znorm | Inf | ||
| sky | -Inf | -Inf | -Inf |
| S/N | 24.8 | 43.1 | 47.3 |
| S/N(c) | 0.0 | 0.0 | 0.0 |
| SN(E/C) |
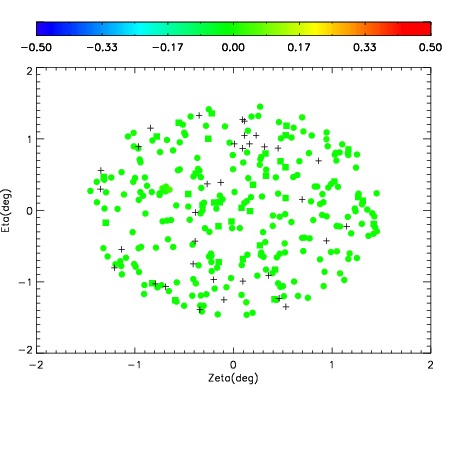
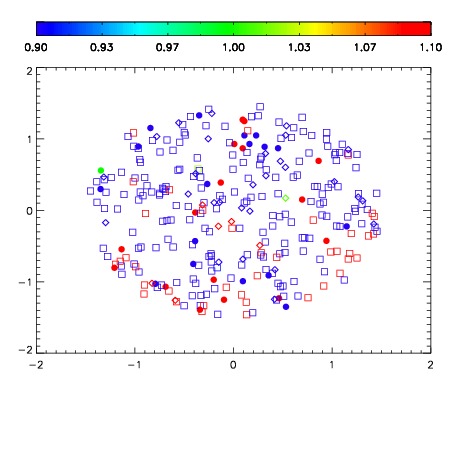


| Frame | Nreads | Zeropoints | Mag plots | Spatial mag deviation | Spatial sky 16325A emission deviations (filled: sky, open: star) | Spatial sky continuum emission | Spatial sky telluric CO2 absorption deviations (filled: H < 10) | |||||||||||||||||||||||
| 0 | 0 |
|
|
|
|
|
|
| IPAIR | NAME | SHIFT | NEWSHIFT | S/N | NAME | SHIFT | NEWSHIFT | S/N |
| 0 | 14310050 | 0.500230 | 0.00000 | 18.9340 | 14310048 | 0.00000 | 0.500230 | 18.9721 |
| 1 | 14310054 | 0.498296 | 0.00193402 | 18.9015 | 14310052 | 6.44206e-05 | 0.500166 | 18.9309 |
| 2 | 14310053 | 0.498359 | 0.00187102 | 18.9010 | 14310055 | 0.00158388 | 0.498646 | 18.9308 |
| 3 | 14310049 | 0.499001 | 0.00122902 | 18.8637 | 14310051 | 0.000216889 | 0.500013 | 18.8620 |