| Red | Green | Blue | |
| z | 17.64 | ||
| znorm | Inf | ||
| sky | -Inf | -NaN | -NaN |
| S/N | 20.3 | 35.8 | 41.0 |
| S/N(c) | 0.0 | 0.0 | 0.0 |
| SN(E/C) |
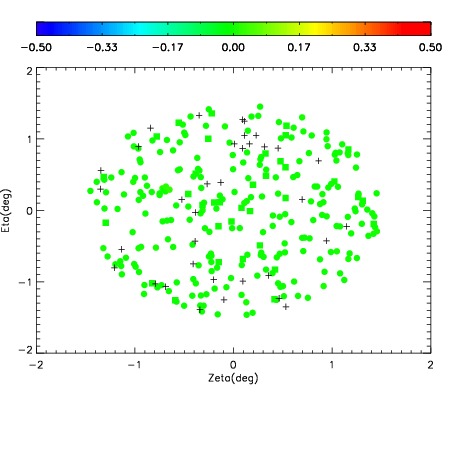
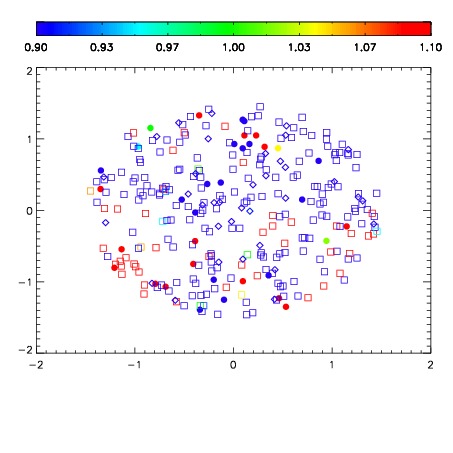


| Frame | Nreads | Zeropoints | Mag plots | Spatial mag deviation | Spatial sky 16325A emission deviations (filled: sky, open: star) | Spatial sky continuum emission | Spatial sky telluric CO2 absorption deviations (filled: H < 10) | |||||||||||||||||||||||
| 0 | 0 |
|
|
|
|
|
|
| IPAIR | NAME | SHIFT | NEWSHIFT | S/N | NAME | SHIFT | NEWSHIFT | S/N |
| 0 | 14420024 | 0.497246 | 0.00000 | 18.8873 | 14420022 | 0.00000 | 0.497246 | 18.9701 |
| 1 | 14420023 | 0.496536 | 0.000710011 | 18.7379 | 14420025 | -0.000385215 | 0.497631 | 18.9288 |
| 2 | 14420027 | 0.496041 | 0.00120500 | 18.5439 | 14420026 | 0.000215258 | 0.497031 | 18.6268 |
| 3 | 14420028 | 0.497196 | 5.00083e-05 | 18.3084 | 14420029 | -0.00288853 | 0.500135 | 18.2347 |