| Red | Green | Blue | |
| z | 17.64 | ||
| znorm | Inf | ||
| sky | -NaN | -Inf | -Inf |
| S/N | 27.5 | 47.7 | 52.4 |
| S/N(c) | 0.0 | 0.0 | 0.0 |
| SN(E/C) |
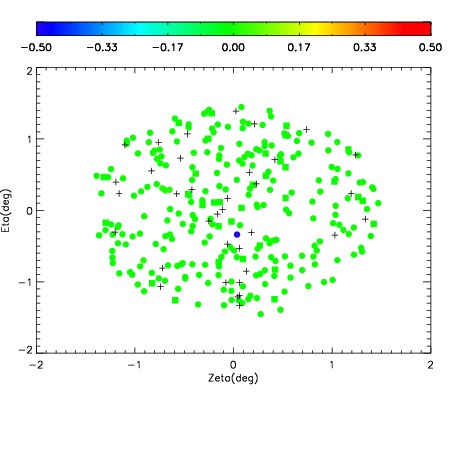

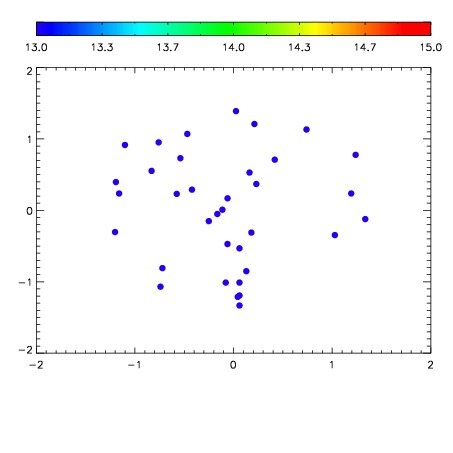

| Frame | Nreads | Zeropoints | Mag plots | Spatial mag deviation | Spatial sky 16325A emission deviations (filled: sky, open: star) | Spatial sky continuum emission | Spatial sky telluric CO2 absorption deviations (filled: H < 10) | |||||||||||||||||||||||
| 0 | 0 |
|
|
|
|
|
|
| IPAIR | NAME | SHIFT | NEWSHIFT | S/N | NAME | SHIFT | NEWSHIFT | S/N |
| 0 | 14590065 | 0.496909 | 0.00000 | 19.0372 | 14590063 | -0.000600858 | 0.497510 | 19.0238 |
| 1 | 14590061 | 0.495763 | 0.00114599 | 19.0851 | 14590066 | 0.00156065 | 0.495348 | 19.0706 |
| 2 | 14590060 | 0.494588 | 0.00232100 | 19.0832 | 14590062 | 0.000346013 | 0.496563 | 19.0432 |
| 3 | 14590064 | 0.495441 | 0.00146800 | 18.9794 | 14590059 | 0.00000 | 0.496909 | 19.0138 |