| Red | Green | Blue | |
| z | 17.64 | ||
| znorm | Inf | ||
| sky | -Inf | -NaN | -NaN |
| S/N | 36.0 | 62.2 | 67.4 |
| S/N(c) | 0.0 | 0.0 | 0.0 |
| SN(E/C) |
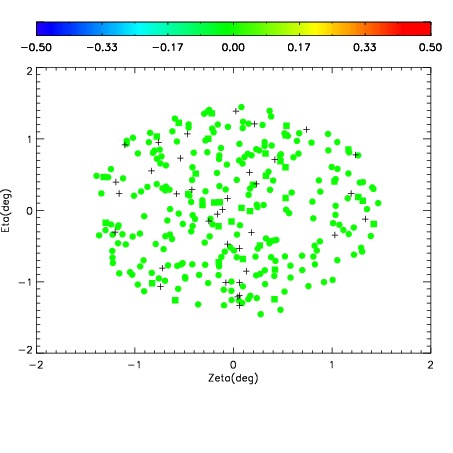
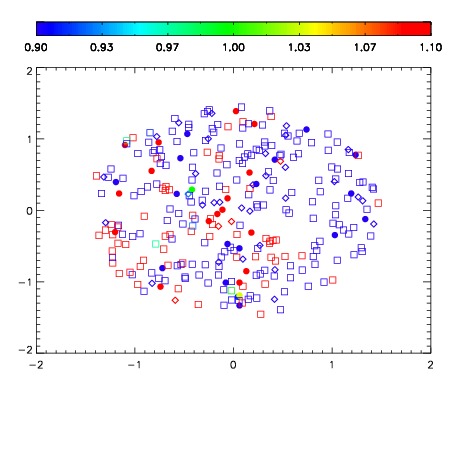
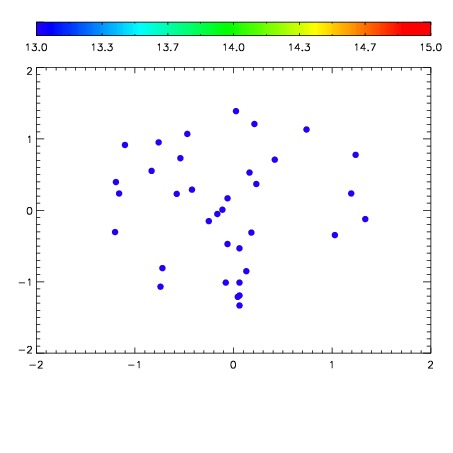

| Frame | Nreads | Zeropoints | Mag plots | Spatial mag deviation | Spatial sky 16325A emission deviations (filled: sky, open: star) | Spatial sky continuum emission | Spatial sky telluric CO2 absorption deviations (filled: H < 10) | |||||||||||||||||||||||
| 0 | 0 |
|
|
|
|
|
|
| IPAIR | NAME | SHIFT | NEWSHIFT | S/N | NAME | SHIFT | NEWSHIFT | S/N |
| 0 | 14650058 | 0.493483 | 0.00000 | 19.1552 | 14650051 | 0.000602389 | 0.492881 | 19.1283 |
| 1 | 14650050 | 0.493179 | 0.000304013 | 19.1992 | 14650059 | 0.00247328 | 0.491010 | 19.1399 |
| 2 | 14650049 | 0.492408 | 0.00107500 | 19.1738 | 14650052 | 0.000591123 | 0.492892 | 19.1343 |
| 3 | 14650057 | 0.492824 | 0.000659019 | 19.1164 | 14650048 | 0.00000 | 0.493483 | 19.1040 |
| 4 | 14650054 | 0.492781 | 0.000701994 | 19.1002 | 14650056 | 0.00253097 | 0.490952 | 19.0941 |
| 5 | 14650053 | 0.492120 | 0.00136301 | 19.0786 | 14650055 | 0.00241454 | 0.491068 | 19.0614 |