| Red | Green | Blue | |
| z | 17.64 | ||
| znorm | Inf | ||
| sky | -Inf | -NaN | -Inf |
| S/N | 30.1 | 50.2 | 55.9 |
| S/N(c) | 0.0 | 0.0 | 0.0 |
| SN(E/C) |

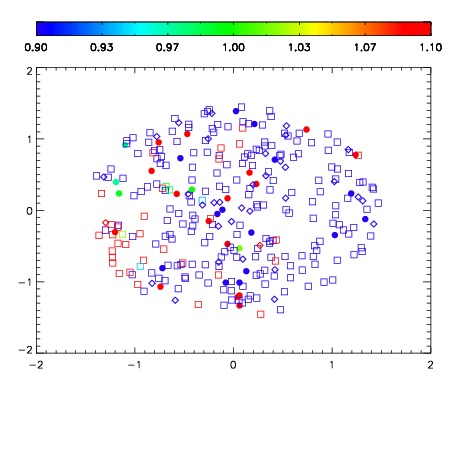
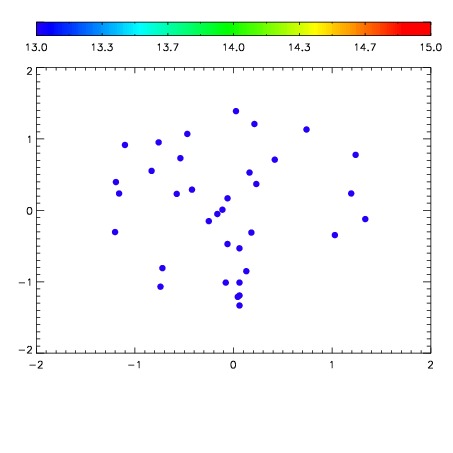

| Frame | Nreads | Zeropoints | Mag plots | Spatial mag deviation | Spatial sky 16325A emission deviations (filled: sky, open: star) | Spatial sky continuum emission | Spatial sky telluric CO2 absorption deviations (filled: H < 10) | |||||||||||||||||||||||
| 0 | 0 |
|
|
|
|
|
|
| IPAIR | NAME | SHIFT | NEWSHIFT | S/N | NAME | SHIFT | NEWSHIFT | S/N |
| 0 | 14880024 | 0.499807 | 0.00000 | 19.1759 | 14880022 | 0.00000 | 0.499807 | 19.1117 |
| 1 | 14880028 | 0.496832 | 0.00297499 | 19.2533 | 14880029 | -0.000113710 | 0.499921 | 19.1874 |
| 2 | 14880027 | 0.496959 | 0.00284800 | 19.1875 | 14880025 | -4.35133e-05 | 0.499851 | 19.1603 |
| 3 | 14880023 | 0.498837 | 0.000970006 | 19.1871 | 14880026 | -0.00106811 | 0.500875 | 19.1567 |