| Red | Green | Blue | |
| z | 17.64 | ||
| znorm | Inf | ||
| sky | -Inf | -Inf | -Inf |
| S/N | 40.2 | 65.3 | 74.4 |
| S/N(c) | 0.0 | 0.0 | 0.0 |
| SN(E/C) |
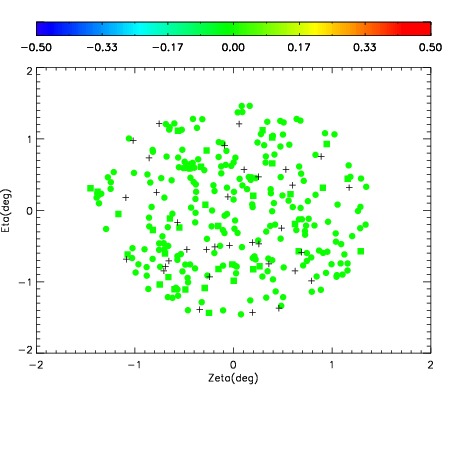
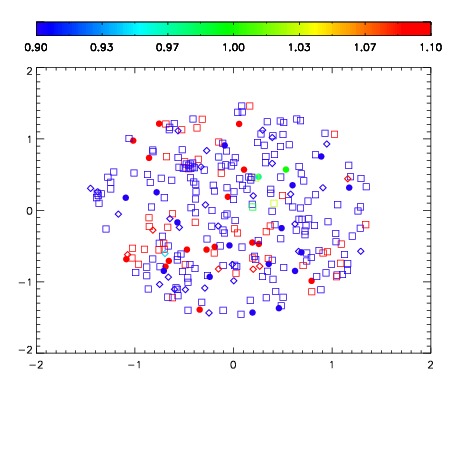
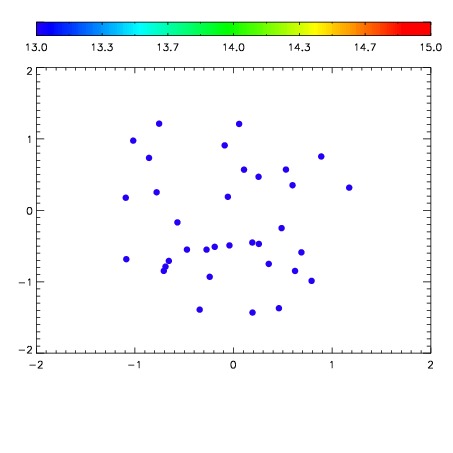

| Frame | Nreads | Zeropoints | Mag plots | Spatial mag deviation | Spatial sky 16325A emission deviations (filled: sky, open: star) | Spatial sky continuum emission | Spatial sky telluric CO2 absorption deviations (filled: H < 10) | |||||||||||||||||||||||
| 0 | 0 |
|
|
|
|
|
|
| IPAIR | NAME | SHIFT | NEWSHIFT | S/N | NAME | SHIFT | NEWSHIFT | S/N |
| 0 | 14100074 | 0.498535 | 0.00000 | 19.2363 | 14100072 | 0.00000 | 0.498535 | 19.2446 |
| 1 | 14100081 | 0.496862 | 0.00167301 | 19.2526 | 14100079 | -0.000159656 | 0.498695 | 19.2719 |
| 2 | 14100073 | 0.497457 | 0.00107801 | 19.2384 | 14100076 | -9.10349e-05 | 0.498626 | 19.2482 |
| 3 | 14100077 | 0.497461 | 0.00107402 | 19.2339 | 14100080 | -0.000384810 | 0.498920 | 19.2354 |
| 4 | 14100082 | 0.497719 | 0.000816017 | 19.2314 | 14100075 | 4.14032e-05 | 0.498494 | 19.2333 |
| 5 | 14100078 | 0.498262 | 0.000273019 | 19.1923 | 14100083 | 0.000652512 | 0.497882 | 19.2269 |