| Red | Green | Blue | |
| z | 17.64 | ||
| znorm | Inf | ||
| sky | -NaN | -Inf | -Inf |
| S/N | 24.5 | 41.3 | 46.1 |
| S/N(c) | 0.0 | 0.0 | 0.0 |
| SN(E/C) |
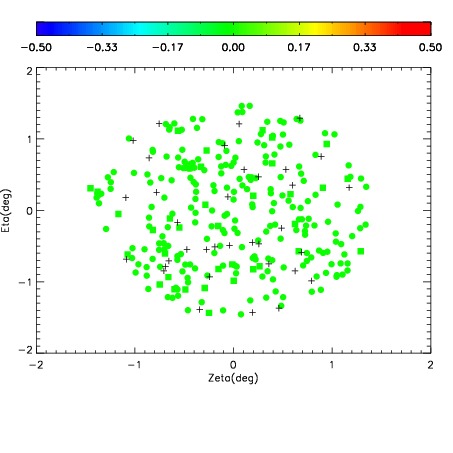
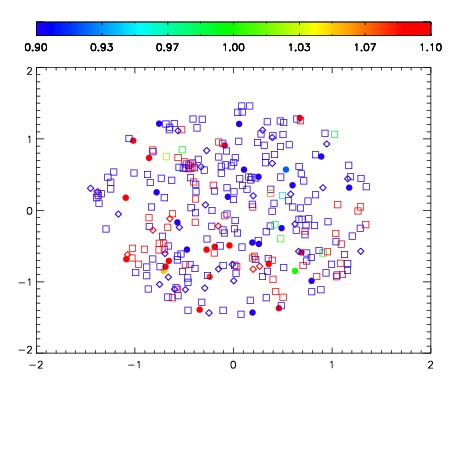
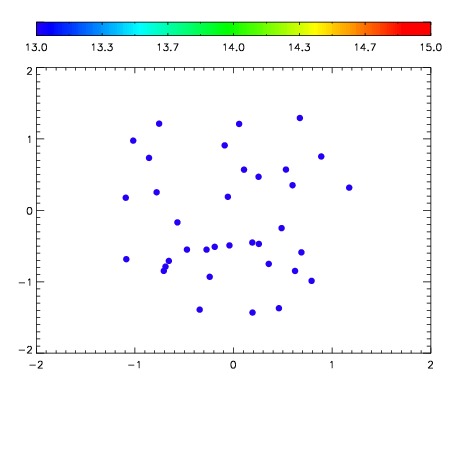

| Frame | Nreads | Zeropoints | Mag plots | Spatial mag deviation | Spatial sky 16325A emission deviations (filled: sky, open: star) | Spatial sky continuum emission | Spatial sky telluric CO2 absorption deviations (filled: H < 10) | |||||||||||||||||||||||
| 0 | 0 |
|
|
|
|
|
|
| IPAIR | NAME | SHIFT | NEWSHIFT | S/N | NAME | SHIFT | NEWSHIFT | S/N |
| 0 | 14370045 | 0.496245 | 0.00000 | 18.8420 | 14370042 | 0.000294227 | 0.495951 | 18.8529 |
| 1 | 14370040 | 0.493664 | 0.00258100 | 18.9481 | 14370046 | 0.00119658 | 0.495048 | 18.8994 |
| 2 | 14370041 | 0.495126 | 0.00111899 | 18.9238 | 14370039 | 0.00000 | 0.496245 | 18.8550 |
| 3 | 14370044 | 0.495840 | 0.000404984 | 18.7336 | 14370043 | 0.000200296 | 0.496045 | 18.6745 |