| Red | Green | Blue | |
| z | 17.64 | ||
| znorm | Inf | ||
| sky | -Inf | -Inf | -Inf |
| S/N | 19.5 | 35.3 | 39.8 |
| S/N(c) | 0.0 | 0.0 | 0.0 |
| SN(E/C) |
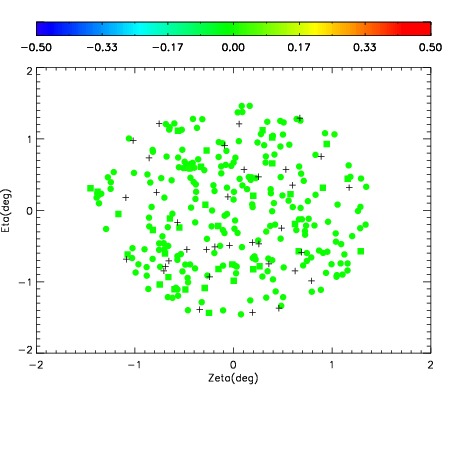
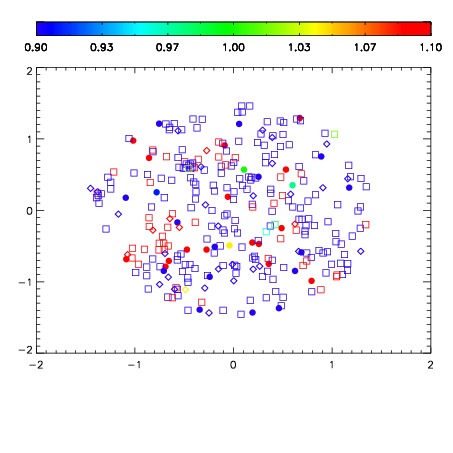
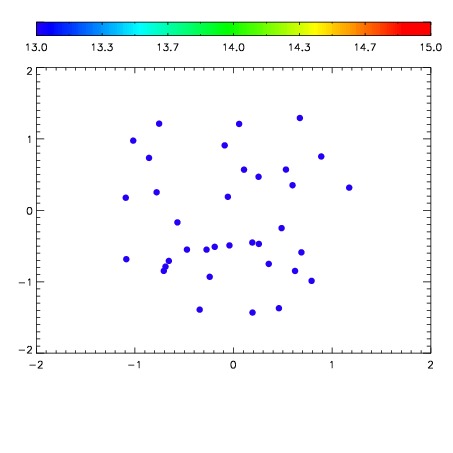

| Frame | Nreads | Zeropoints | Mag plots | Spatial mag deviation | Spatial sky 16325A emission deviations (filled: sky, open: star) | Spatial sky continuum emission | Spatial sky telluric CO2 absorption deviations (filled: H < 10) | |||||||||||||||||||||||
| 0 | 0 |
|
|
|
|
|
|
| IPAIR | NAME | SHIFT | NEWSHIFT | S/N | NAME | SHIFT | NEWSHIFT | S/N |
| 0 | 14440055 | 0.499080 | 0.00000 | 18.4780 | 14440052 | 0.000379752 | 0.498700 | 18.6379 |
| 1 | 14440050 | 0.497046 | 0.00203401 | 18.6570 | 14440053 | 0.000104371 | 0.498976 | 18.6550 |
| 2 | 14440054 | 0.497458 | 0.00162199 | 18.6298 | 14440049 | 0.00000 | 0.499080 | 18.6465 |
| 3 | 14440051 | 0.497273 | 0.00180700 | 18.4754 | 14440056 | 0.000400247 | 0.498680 | 18.5424 |