| Red | Green | Blue | |
| z | 17.64 | ||
| znorm | Inf | ||
| sky | -Inf | -Inf | -Inf |
| S/N | 25.3 | 45.1 | 49.6 |
| S/N(c) | 0.0 | 0.0 | 0.0 |
| SN(E/C) |
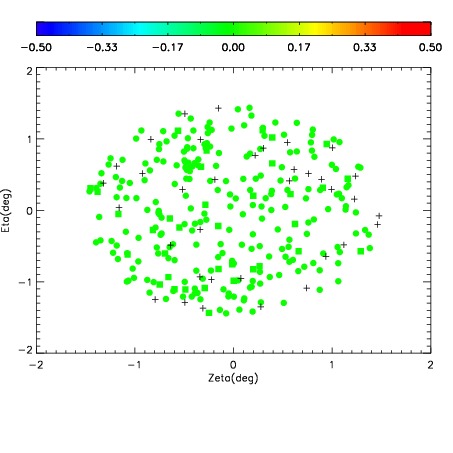


| Frame | Nreads | Zeropoints | Mag plots | Spatial mag deviation | Spatial sky 16325A emission deviations (filled: sky, open: star) | Spatial sky continuum emission | Spatial sky telluric CO2 absorption deviations (filled: H < 10) | |||||||||||||||||||||||
| 0 | 0 |
|
|
|
|
|
|
| IPAIR | NAME | SHIFT | NEWSHIFT | S/N | NAME | SHIFT | NEWSHIFT | S/N |
| 0 | 14590072 | 0.498393 | 0.00000 | 18.9081 | 14590070 | 0.00000 | 0.498393 | 18.8276 |
| 1 | 14590075 | 0.497573 | 0.000820011 | 18.9583 | 14590073 | 0.00108936 | 0.497304 | 18.9691 |
| 2 | 14590071 | 0.497011 | 0.00138199 | 18.9224 | 14590077 | 0.000994112 | 0.497399 | 18.9671 |
| 3 | 14590076 | 0.497925 | 0.000467986 | 18.9133 | 14590074 | 0.00135294 | 0.497040 | 18.9580 |