| Red | Green | Blue | |
| z | 17.64 | ||
| znorm | Inf | ||
| sky | -Inf | -NaN | -Inf |
| S/N | 23.6 | 39.4 | 45.3 |
| S/N(c) | 0.0 | 0.0 | 0.0 |
| SN(E/C) |

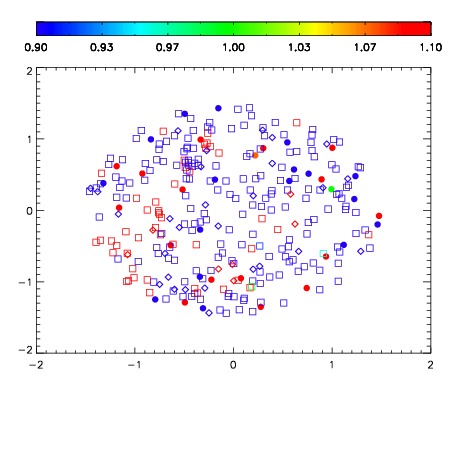
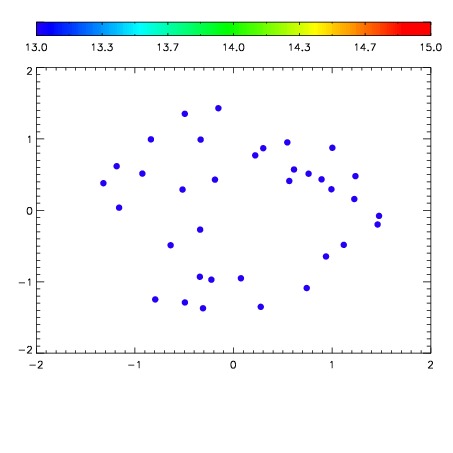

| Frame | Nreads | Zeropoints | Mag plots | Spatial mag deviation | Spatial sky 16325A emission deviations (filled: sky, open: star) | Spatial sky continuum emission | Spatial sky telluric CO2 absorption deviations (filled: H < 10) | |||||||||||||||||||||||
| 0 | 0 |
|
|
|
|
|
|
| IPAIR | NAME | SHIFT | NEWSHIFT | S/N | NAME | SHIFT | NEWSHIFT | S/N |
| 0 | 14890035 | 0.495044 | 0.00000 | 19.0127 | 14890033 | 0.00000 | 0.495044 | 19.0324 |
| 1 | 14890034 | 0.493798 | 0.00124601 | 19.0389 | 14890037 | -0.00112151 | 0.496166 | 19.0475 |
| 2 | 14890038 | 0.494007 | 0.00103700 | 19.0076 | 14890036 | -0.000124964 | 0.495169 | 19.0274 |