| Red | Green | Blue | |
| z | 17.64 | ||
| znorm | Inf | ||
| sky | -Inf | -Inf | -Inf |
| S/N | 29.1 | 46.9 | 54.6 |
| S/N(c) | 0.0 | 0.0 | 0.0 |
| SN(E/C) |


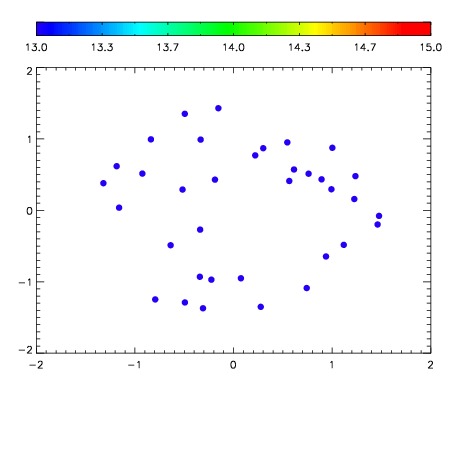

| Frame | Nreads | Zeropoints | Mag plots | Spatial mag deviation | Spatial sky 16325A emission deviations (filled: sky, open: star) | Spatial sky continuum emission | Spatial sky telluric CO2 absorption deviations (filled: H < 10) | |||||||||||||||||||||||
| 0 | 0 |
|
|
|
|
|
|
| IPAIR | NAME | SHIFT | NEWSHIFT | S/N | NAME | SHIFT | NEWSHIFT | S/N |
| 0 | 14950015 | 0.500822 | 0.00000 | 19.0925 | 14950013 | 0.00000 | 0.500822 | 19.0569 |
| 1 | 14950014 | 0.500632 | 0.000190020 | 19.1248 | 14950020 | -0.00136514 | 0.502187 | 19.1190 |
| 2 | 14950018 | 0.497818 | 0.00300401 | 19.1238 | 14950017 | -0.000536272 | 0.501358 | 19.0935 |
| 3 | 14950019 | 0.498227 | 0.00259501 | 19.0948 | 14950016 | -0.000309048 | 0.501131 | 19.0832 |