| Red | Green | Blue | |
| z | 17.64 | ||
| znorm | Inf | ||
| sky | -Inf | -Inf | -NaN |
| S/N | 26.6 | 43.4 | 48.3 |
| S/N(c) | 0.0 | 0.0 | 0.0 |
| SN(E/C) |

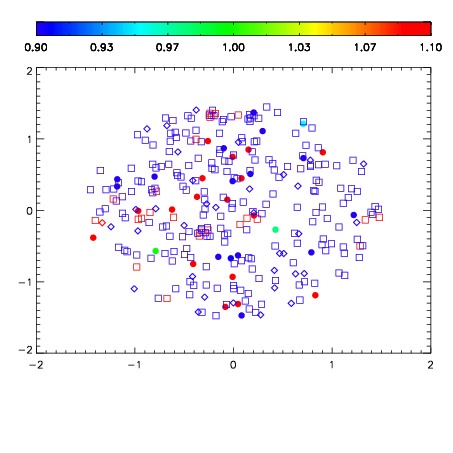
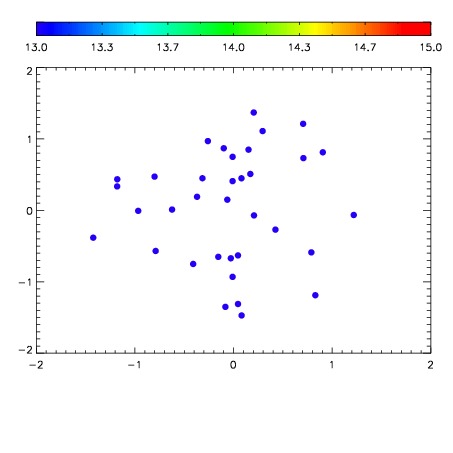

| Frame | Nreads | Zeropoints | Mag plots | Spatial mag deviation | Spatial sky 16325A emission deviations (filled: sky, open: star) | Spatial sky continuum emission | Spatial sky telluric CO2 absorption deviations (filled: H < 10) | |||||||||||||||||||||||
| 0 | 0 |
|
|
|
|
|
|
| IPAIR | NAME | SHIFT | NEWSHIFT | S/N | NAME | SHIFT | NEWSHIFT | S/N |
| 0 | 13830059 | 0.496377 | 0.00000 | 19.2160 | 13830058 | 0.00000 | 0.496377 | 19.2134 |
| 1 | 13830060 | 0.492029 | 0.00434798 | 19.2735 | 13830062 | 9.93056e-05 | 0.496278 | 19.2948 |
| 2 | 13830063 | 0.490626 | 0.00575098 | 19.2604 | 13830061 | -0.00126688 | 0.497644 | 19.2923 |