| Red | Green | Blue | |
| z | 17.64 | ||
| znorm | Inf | ||
| sky | -Inf | -Inf | -Inf |
| S/N | 15.1 | 25.7 | 30.1 |
| S/N(c) | 0.0 | 0.0 | 0.0 |
| SN(E/C) |
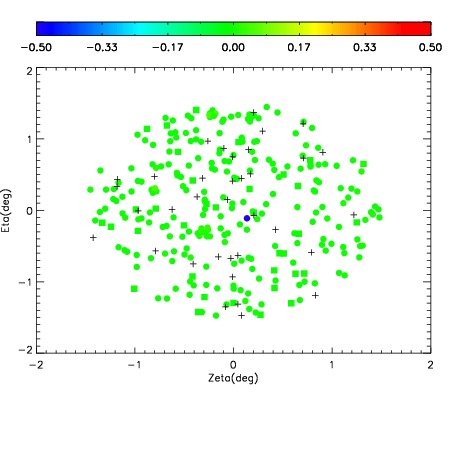
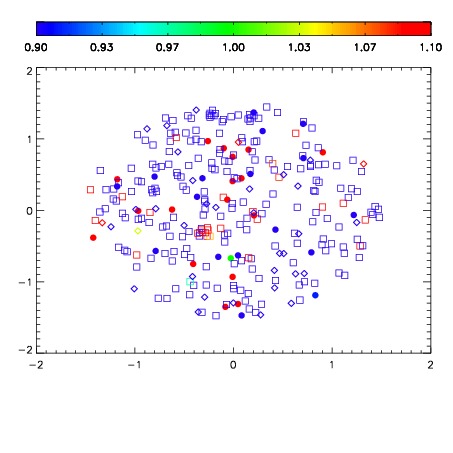


| Frame | Nreads | Zeropoints | Mag plots | Spatial mag deviation | Spatial sky 16325A emission deviations (filled: sky, open: star) | Spatial sky continuum emission | Spatial sky telluric CO2 absorption deviations (filled: H < 10) | |||||||||||||||||||||||
| 0 | 0 |
|
|
|
|
|
|
| IPAIR | NAME | SHIFT | NEWSHIFT | S/N | NAME | SHIFT | NEWSHIFT | S/N |
| 0 | 14380062 | 0.493067 | 0.00000 | 18.2125 | 14380061 | 0.00156519 | 0.491502 | 18.0932 |
| 1 | 14380058 | 0.491706 | 0.00136098 | 18.5443 | 14380057 | 0.00000 | 0.493067 | 18.5359 |
| 2 | 14380059 | 0.492743 | 0.000324011 | 18.3711 | 14380064 | 0.000643867 | 0.492423 | 18.4674 |
| 3 | 14380063 | 0.492495 | 0.000571996 | 18.3548 | 14380060 | 0.000639028 | 0.492428 | 18.3996 |