| Red | Green | Blue | |
| z | 17.64 | ||
| znorm | Inf | ||
| sky | -Inf | -Inf | -Inf |
| S/N | 23.9 | 38.7 | 42.5 |
| S/N(c) | 0.0 | 0.0 | 0.0 |
| SN(E/C) |


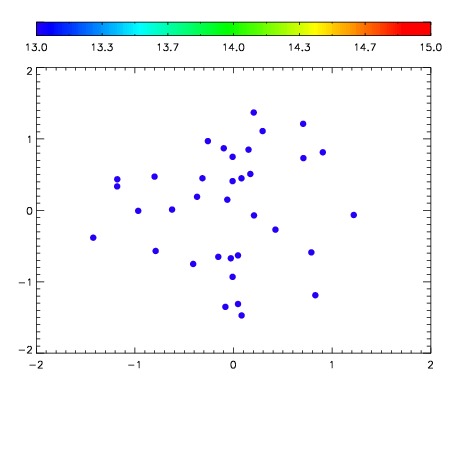

| Frame | Nreads | Zeropoints | Mag plots | Spatial mag deviation | Spatial sky 16325A emission deviations (filled: sky, open: star) | Spatial sky continuum emission | Spatial sky telluric CO2 absorption deviations (filled: H < 10) | |||||||||||||||||||||||
| 0 | 0 |
|
|
|
|
|
|
| IPAIR | NAME | SHIFT | NEWSHIFT | S/N | NAME | SHIFT | NEWSHIFT | S/N |
| 0 | 14420012 | 0.494176 | 0.00000 | 18.9006 | 14420011 | 0.00000 | 0.494176 | 18.9831 |
| 1 | 14420017 | 0.491496 | 0.00268000 | 18.8504 | 14420018 | -0.00204834 | 0.496224 | 18.8629 |
| 2 | 14420013 | 0.493719 | 0.000456989 | 18.8180 | 14420014 | -0.00148092 | 0.495657 | 18.6812 |
| 3 | 14420016 | 0.492680 | 0.00149599 | 18.5688 | 14420015 | -0.00141546 | 0.495591 | 18.6561 |