| Red | Green | Blue | |
| z | 17.64 | ||
| znorm | Inf | ||
| sky | -Inf | -Inf | -Inf |
| S/N | 28.9 | 48.9 | 55.0 |
| S/N(c) | 0.0 | 0.0 | 0.0 |
| SN(E/C) |
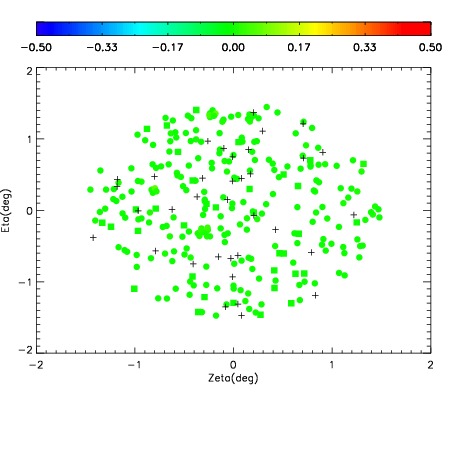
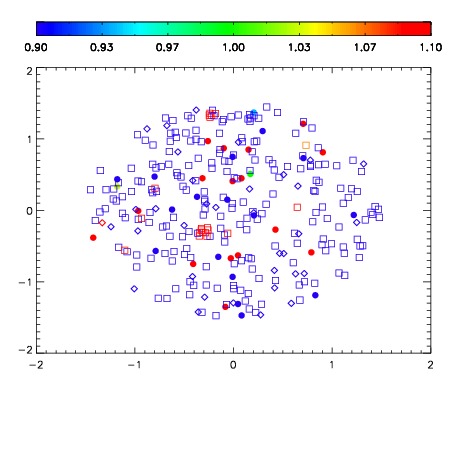
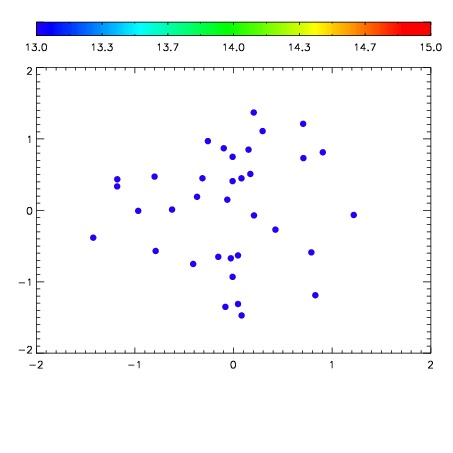

| Frame | Nreads | Zeropoints | Mag plots | Spatial mag deviation | Spatial sky 16325A emission deviations (filled: sky, open: star) | Spatial sky continuum emission | Spatial sky telluric CO2 absorption deviations (filled: H < 10) | |||||||||||||||||||||||
| 0 | 0 |
|
|
|
|
|
|
| IPAIR | NAME | SHIFT | NEWSHIFT | S/N | NAME | SHIFT | NEWSHIFT | S/N |
| 0 | 14880039 | 0.457234 | 0.00000 | 19.1266 | 14880041 | -0.00301729 | 0.460251 | 19.1647 |
| 1 | 14880038 | 0.456070 | 0.00116399 | 19.1776 | 14880040 | -0.00236763 | 0.459602 | 19.1721 |
| 2 | 14880043 | 0.448428 | 0.00880599 | 19.1390 | 14880037 | 0.00000 | 0.457234 | 19.1719 |
| 3 | 14880042 | 0.452516 | 0.00471801 | 19.1232 | 14880044 | -0.00378429 | 0.461018 | 19.0110 |