| Red | Green | Blue | |
| z | 17.64 | ||
| znorm | Inf | ||
| sky | -Inf | -Inf | -Inf |
| S/N | 21.1 | 37.3 | 40.5 |
| S/N(c) | 0.0 | 0.0 | 0.0 |
| SN(E/C) |
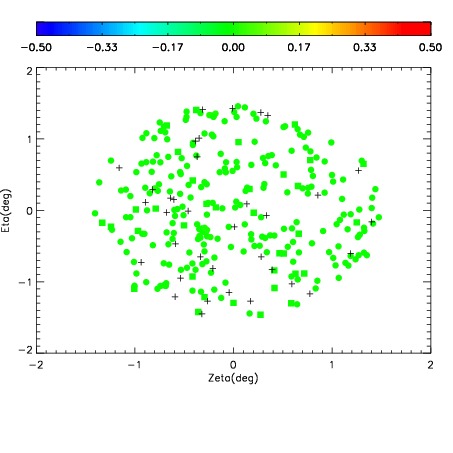
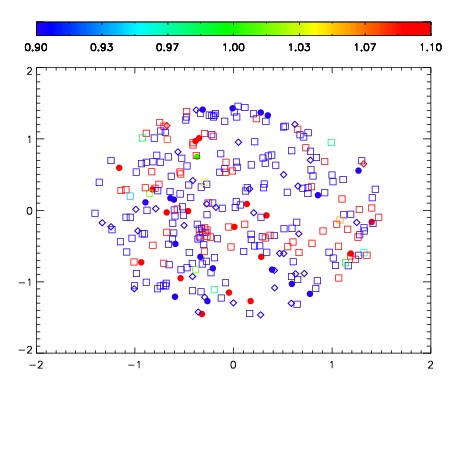


| Frame | Nreads | Zeropoints | Mag plots | Spatial mag deviation | Spatial sky 16325A emission deviations (filled: sky, open: star) | Spatial sky continuum emission | Spatial sky telluric CO2 absorption deviations (filled: H < 10) | |||||||||||||||||||||||
| 0 | 0 |
|
|
|
|
|
|
| IPAIR | NAME | SHIFT | NEWSHIFT | S/N | NAME | SHIFT | NEWSHIFT | S/N |
| 0 | 14440044 | 0.498096 | 0.00000 | 18.6092 | 14440038 | 0.00000 | 0.498096 | 18.6991 |
| 1 | 14440040 | 0.497933 | 0.000162989 | 18.7595 | 14440041 | -0.000286561 | 0.498383 | 18.8990 |
| 2 | 14440043 | 0.497499 | 0.000597000 | 18.7355 | 14440042 | -0.000355583 | 0.498452 | 18.7732 |
| 3 | 14440039 | 0.497966 | 0.000129998 | 18.5802 | 14440045 | -0.000679206 | 0.498775 | 18.5639 |