| Red | Green | Blue | |
| z | 17.64 | ||
| znorm | Inf | ||
| sky | -Inf | -Inf | -NaN |
| S/N | 26.7 | 42.3 | 48.0 |
| S/N(c) | 0.0 | 0.0 | 0.0 |
| SN(E/C) |


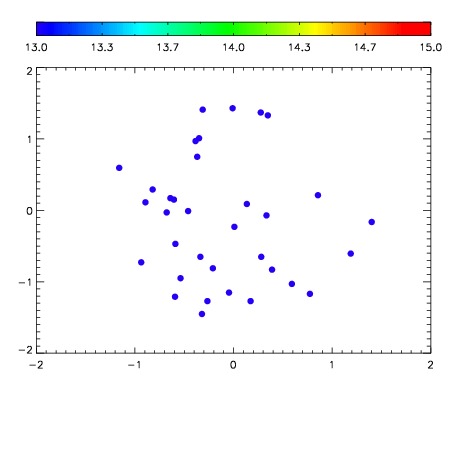

| Frame | Nreads | Zeropoints | Mag plots | Spatial mag deviation | Spatial sky 16325A emission deviations (filled: sky, open: star) | Spatial sky continuum emission | Spatial sky telluric CO2 absorption deviations (filled: H < 10) | |||||||||||||||||||||||
| 0 | 0 |
|
|
|
|
|
|
| IPAIR | NAME | SHIFT | NEWSHIFT | S/N | NAME | SHIFT | NEWSHIFT | S/N |
| 0 | 14590050 | 0.496049 | 0.00000 | 18.9926 | 14590052 | -0.000542950 | 0.496592 | 19.0339 |
| 1 | 14590049 | 0.495935 | 0.000113994 | 18.9985 | 14590051 | -0.000124055 | 0.496173 | 19.0499 |
| 2 | 14590053 | 0.495781 | 0.000267982 | 18.9179 | 14590048 | 0.00000 | 0.496049 | 18.9959 |
| 3 | 14590054 | 0.495819 | 0.000229985 | 18.7805 | 14590055 | 0.000192615 | 0.495856 | 18.9760 |