| Red | Green | Blue | |
| z | 17.64 | ||
| znorm | Inf | ||
| sky | -Inf | -NaN | -NaN |
| S/N | 22.8 | 38.1 | 43.2 |
| S/N(c) | 0.0 | 0.0 | 0.0 |
| SN(E/C) |
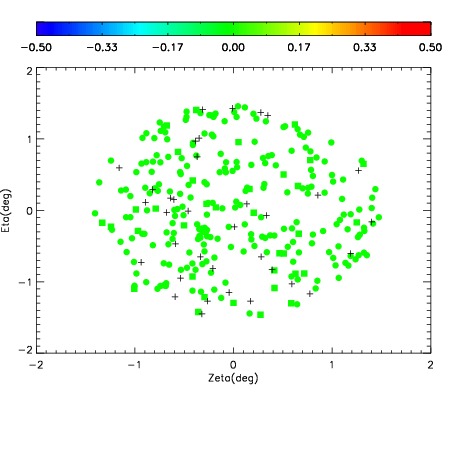
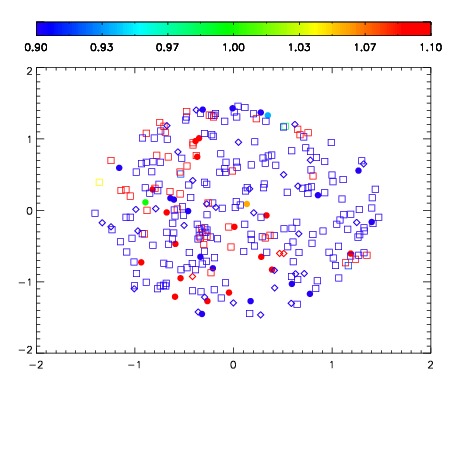
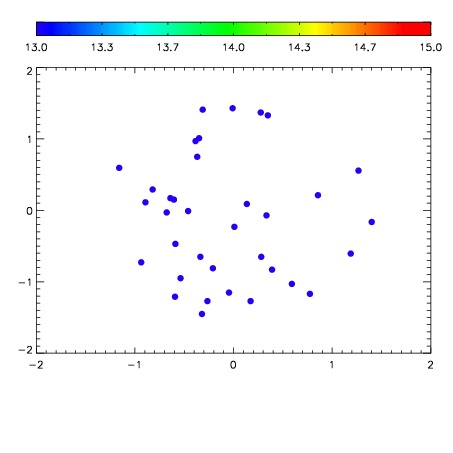

| Frame | Nreads | Zeropoints | Mag plots | Spatial mag deviation | Spatial sky 16325A emission deviations (filled: sky, open: star) | Spatial sky continuum emission | Spatial sky telluric CO2 absorption deviations (filled: H < 10) | |||||||||||||||||||||||
| 0 | 0 |
|
|
|
|
|
|
| IPAIR | NAME | SHIFT | NEWSHIFT | S/N | NAME | SHIFT | NEWSHIFT | S/N |
| 0 | 14890028 | 0.500136 | 0.00000 | 18.8864 | 14890029 | 2.68259e-05 | 0.500109 | 18.9384 |
| 1 | 14890024 | 0.499392 | 0.000744015 | 18.8558 | 14890025 | -0.00101817 | 0.501154 | 18.8620 |
| 2 | 14890027 | 0.498990 | 0.00114602 | 18.8281 | 14890026 | -0.00154331 | 0.501679 | 18.8317 |
| 3 | 14890023 | 0.499154 | 0.000982016 | 18.7558 | 14890022 | 0.00000 | 0.500136 | 18.8211 |