| Red | Green | Blue | |
| z | 17.63 | ||
| znorm | Inf | ||
| sky | -NaN | -NaN | -NaN |
| S/N | 32.3 | 51.2 | 57.6 |
| S/N(c) | 0.0 | 0.0 | 0.0 |
| SN(E/C) |
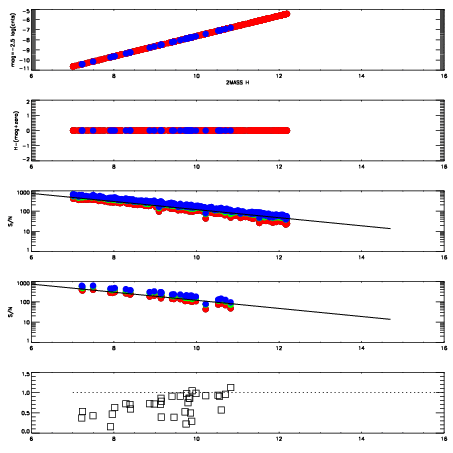
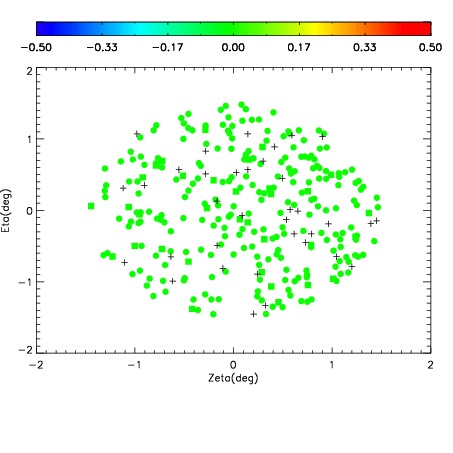
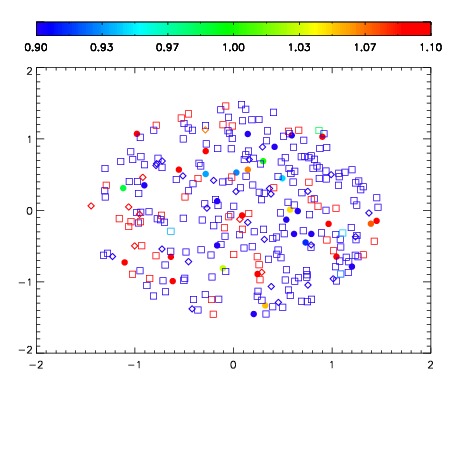
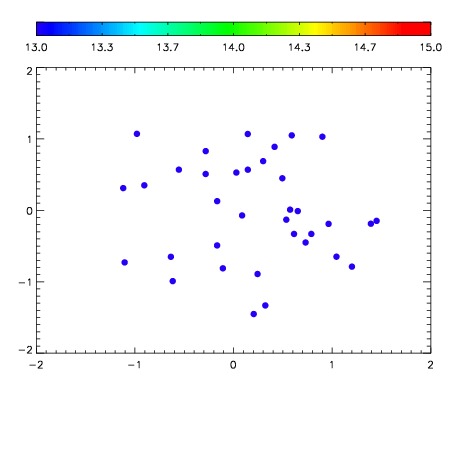

| Frame | Nreads | Zeropoints | Mag plots | Spatial mag deviation | Spatial sky 16325A emission deviations (filled: sky, open: star) | Spatial sky continuum emission | Spatial sky telluric CO2 absorption deviations (filled: H < 10) | |||||||||||||||||||||||
| 0 | 0 |
|
|
|
|
|
|
| IPAIR | NAME | SHIFT | NEWSHIFT | S/N | NAME | SHIFT | NEWSHIFT | S/N |
| 0 | 13830053 | 0.500165 | 0.00000 | 19.2764 | 13830054 | -0.000759642 | 0.500925 | 19.2799 |
| 1 | 13830048 | 0.498928 | 0.00123698 | 19.2100 | 13830047 | 0.00000 | 0.500165 | 19.2617 |
| 2 | 13830052 | 0.499578 | 0.000586987 | 19.1954 | 13830051 | -0.000119334 | 0.500284 | 19.2240 |
| 3 | 13830049 | 0.499315 | 0.000849992 | 19.1522 | 13830050 | 0.000262177 | 0.499903 | 19.1936 |