| Red | Green | Blue | |
| z | 17.64 | ||
| znorm | Inf | ||
| sky | -Inf | -Inf | -Inf |
| S/N | 3.4 | 6.9 | 7.7 |
| S/N(c) | 0.0 | 0.0 | 0.0 |
| SN(E/C) |
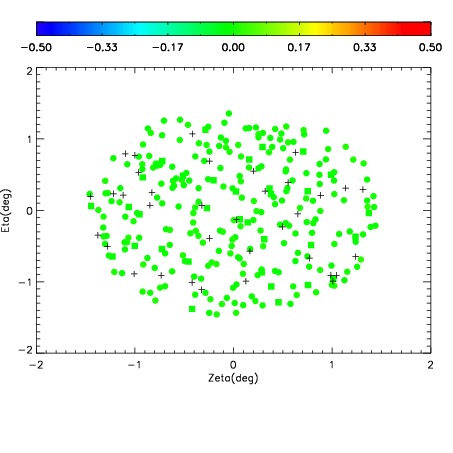
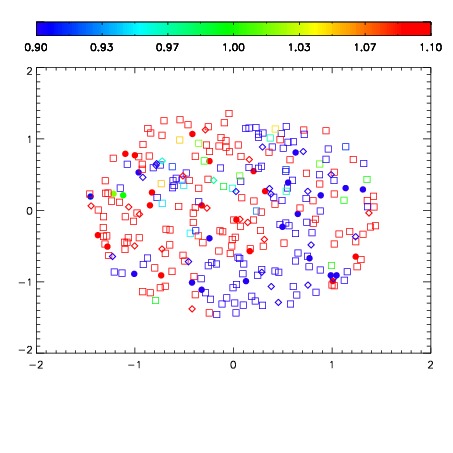
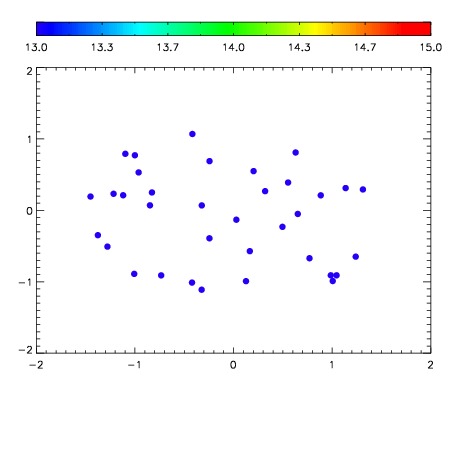

| Frame | Nreads | Zeropoints | Mag plots | Spatial mag deviation | Spatial sky 16325A emission deviations (filled: sky, open: star) | Spatial sky continuum emission | Spatial sky telluric CO2 absorption deviations (filled: H < 10) | |||||||||||||||||||||||
| 0 | 0 |
|
|
|
|
|
|
| IPAIR | NAME | SHIFT | NEWSHIFT | S/N | NAME | SHIFT | NEWSHIFT | S/N |
| 0 | 13760094 | 0.506552 | 0.00000 | 16.8683 | 13760095 | -0.000935326 | 0.507487 | 17.4221 |
| 1 | 13760093 | 0.506067 | 0.000485003 | 15.6180 | 13760096 | -0.000551205 | 0.507103 | 16.1880 |
| 2 | 13760097 | 0.504978 | 0.00157398 | 13.8095 | 13760092 | 0.00000 | 0.506552 | 15.8192 |