| Red | Green | Blue | |
| z | 17.64 | ||
| znorm | Inf | ||
| sky | -Inf | -Inf | -NaN |
| S/N | 31.1 | 52.9 | 58.0 |
| S/N(c) | 0.0 | 0.0 | 0.0 |
| SN(E/C) |
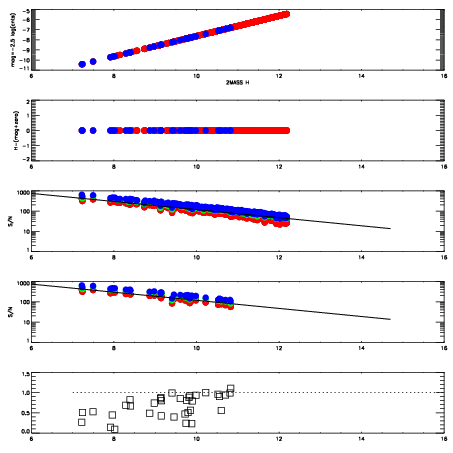

| Frame | Nreads | Zeropoints | Mag plots | Spatial mag deviation | Spatial sky 16325A emission deviations (filled: sky, open: star) | Spatial sky continuum emission | Spatial sky telluric CO2 absorption deviations (filled: H < 10) | |||||||||||||||||||||||
| 0 | 0 |
|
|
|
|
|
|
| IPAIR | NAME | SHIFT | NEWSHIFT | S/N | NAME | SHIFT | NEWSHIFT | S/N |
| 0 | 13840054 | 0.502340 | 0.00000 | 19.2189 | 13840048 | 0.00000 | 0.502340 | 19.2140 |
| 1 | 13840050 | 0.502148 | 0.000192046 | 19.2607 | 13840052 | 0.000563687 | 0.501776 | 19.2670 |
| 2 | 13840053 | 0.501900 | 0.000440001 | 19.2598 | 13840051 | 0.000966687 | 0.501373 | 19.2371 |
| 3 | 13840049 | 0.502217 | 0.000123024 | 19.2341 | 13840055 | -0.000179251 | 0.502519 | 19.2145 |