| Red | Green | Blue | |
| z | 17.64 | ||
| znorm | Inf | ||
| sky | -Inf | -NaN | -NaN |
| S/N | 31.9 | 54.1 | 58.9 |
| S/N(c) | 0.0 | 0.0 | 0.0 |
| SN(E/C) |
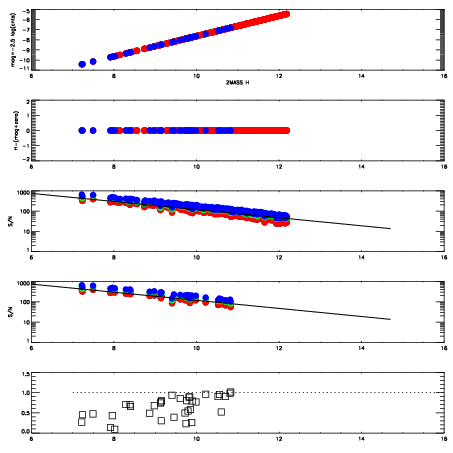
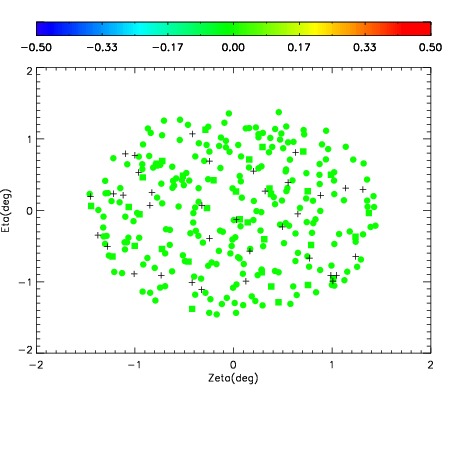
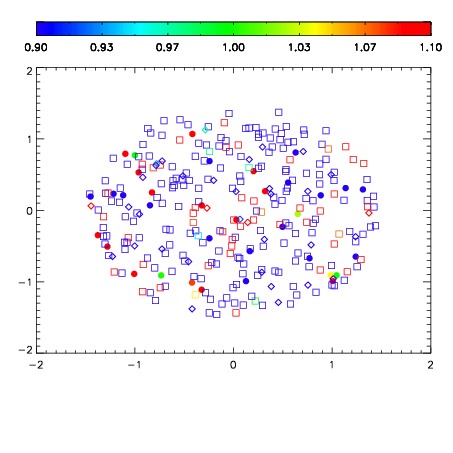
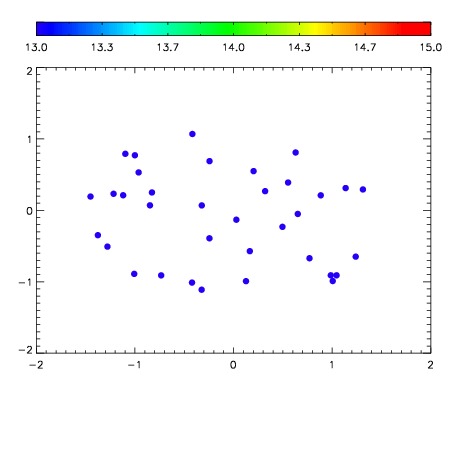

| Frame | Nreads | Zeropoints | Mag plots | Spatial mag deviation | Spatial sky 16325A emission deviations (filled: sky, open: star) | Spatial sky continuum emission | Spatial sky telluric CO2 absorption deviations (filled: H < 10) | |||||||||||||||||||||||
| 0 | 0 |
|
|
|
|
|
|
| IPAIR | NAME | SHIFT | NEWSHIFT | S/N | NAME | SHIFT | NEWSHIFT | S/N |
| 0 | 13850039 | 0.503318 | 0.00000 | 19.2998 | 13850044 | -0.000172624 | 0.503491 | 19.2953 |
| 1 | 13850043 | 0.502497 | 0.000820994 | 19.2911 | 13850041 | -0.000273663 | 0.503592 | 19.2803 |
| 2 | 13850042 | 0.502525 | 0.000793040 | 19.2855 | 13850040 | -0.000192647 | 0.503511 | 19.2667 |
| 3 | 13850038 | 0.502540 | 0.000778019 | 19.2833 | 13850037 | 0.00000 | 0.503318 | 19.2608 |