| Red | Green | Blue | |
| z | 17.64 | ||
| znorm | Inf | ||
| sky | -Inf | -NaN | -NaN |
| S/N | 23.5 | 41.4 | 44.2 |
| S/N(c) | 0.0 | 0.0 | 0.0 |
| SN(E/C) |

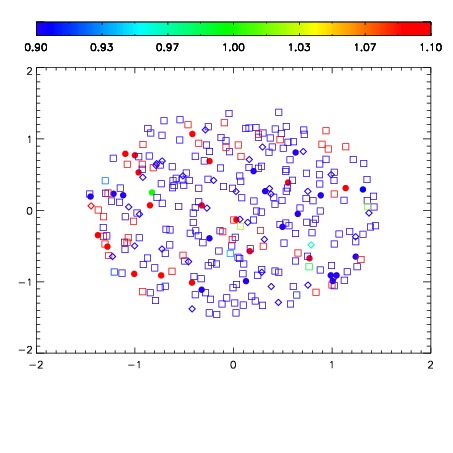


| Frame | Nreads | Zeropoints | Mag plots | Spatial mag deviation | Spatial sky 16325A emission deviations (filled: sky, open: star) | Spatial sky continuum emission | Spatial sky telluric CO2 absorption deviations (filled: H < 10) | |||||||||||||||||||||||
| 0 | 0 |
|
|
|
|
|
|
| IPAIR | NAME | SHIFT | NEWSHIFT | S/N | NAME | SHIFT | NEWSHIFT | S/N |
| 0 | 14280057 | 0.501218 | 0.00000 | 19.0529 | 14280059 | -0.000826968 | 0.502045 | 19.1474 |
| 1 | 14280056 | 0.500925 | 0.000293016 | 19.0479 | 14280058 | -0.00102772 | 0.502246 | 19.1148 |
| 2 | 14280060 | 0.500228 | 0.000990033 | 19.0394 | 14280055 | 0.00000 | 0.501218 | 19.0324 |