| Red | Green | Blue | |
| z | 17.64 | ||
| znorm | Inf | ||
| sky | -Inf | -Inf | -Inf |
| S/N | 22.2 | 37.0 | 43.5 |
| S/N(c) | 0.0 | 0.0 | 0.0 |
| SN(E/C) |
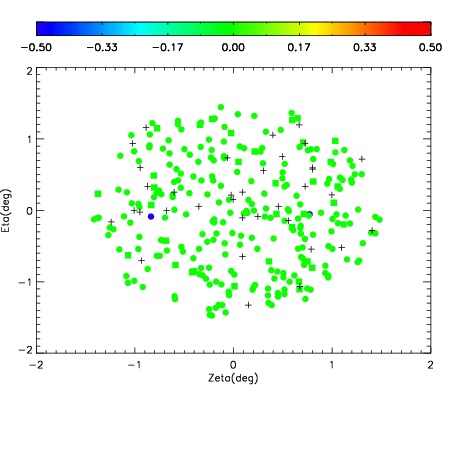
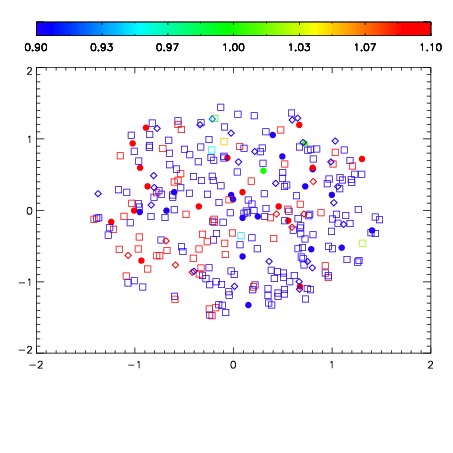
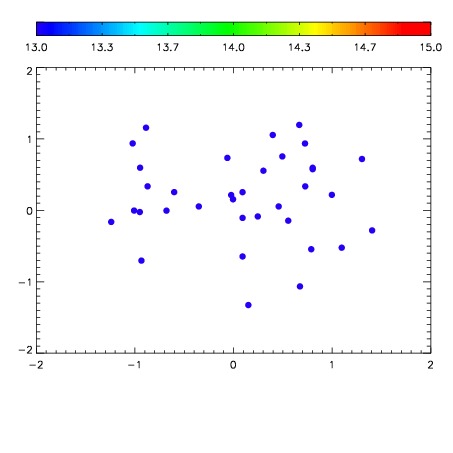

| Frame | Nreads | Zeropoints | Mag plots | Spatial mag deviation | Spatial sky 16325A emission deviations (filled: sky, open: star) | Spatial sky continuum emission | Spatial sky telluric CO2 absorption deviations (filled: H < 10) | |||||||||||||||||||||||
| 0 | 0 |
|
|
|
|
|
|
| IPAIR | NAME | SHIFT | NEWSHIFT | S/N | NAME | SHIFT | NEWSHIFT | S/N |
| 0 | 14680028 | 0.497006 | 0.00000 | 18.6411 | 14680024 | 0.000533445 | 0.496473 | 18.6762 |
| 1 | 14680023 | 0.496596 | 0.000409991 | 19.0882 | 14680022 | 0.00000 | 0.497006 | 19.0463 |
| 2 | 14680027 | 0.494257 | 0.00274900 | 19.0839 | 14680026 | -0.00107023 | 0.498076 | 19.0181 |
| 3 | 14680025 | 0.495349 | 0.00165701 | 18.7477 | 14680029 | 0.000854566 | 0.496151 | 18.7919 |