| Red | Green | Blue | |
| z | 17.64 | ||
| znorm | Inf | ||
| sky | -Inf | -Inf | -NaN |
| S/N | 14.7 | 24.2 | 28.4 |
| S/N(c) | 0.0 | 0.0 | 0.0 |
| SN(E/C) |


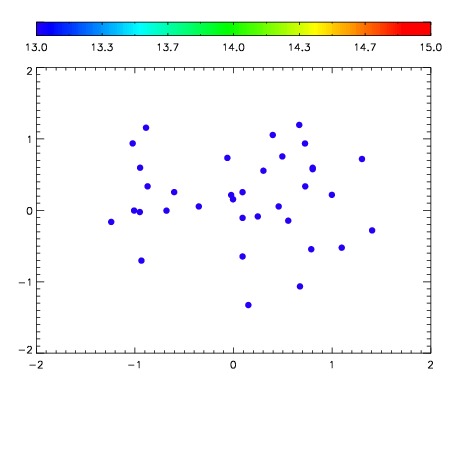

| Frame | Nreads | Zeropoints | Mag plots | Spatial mag deviation | Spatial sky 16325A emission deviations (filled: sky, open: star) | Spatial sky continuum emission | Spatial sky telluric CO2 absorption deviations (filled: H < 10) | |||||||||||||||||||||||
| 0 | 0 |
|
|
|
|
|
|
| IPAIR | NAME | SHIFT | NEWSHIFT | S/N | NAME | SHIFT | NEWSHIFT | S/N |
| 0 | 14960042 | 0.498781 | 0.00000 | 16.8117 | 14960041 | -0.000774765 | 0.499556 | 17.4790 |
| 1 | 14960039 | 0.493706 | 0.00507501 | 18.7811 | 14960040 | -0.00215736 | 0.500938 | 18.5595 |
| 2 | 14960043 | 0.494923 | 0.00385800 | 18.5412 | 14960037 | 0.00000 | 0.498781 | 18.3520 |
| 3 | 14960038 | 0.495256 | 0.00352499 | 18.4760 | 14960044 | -3.08228e-05 | 0.498812 | 17.7287 |