| Red | Green | Blue | |
| z | 17.64 | ||
| znorm | Inf | ||
| sky | -Inf | -Inf | -Inf |
| S/N | 26.0 | 42.7 | 46.9 |
| S/N(c) | 0.0 | 0.0 | 0.0 |
| SN(E/C) |
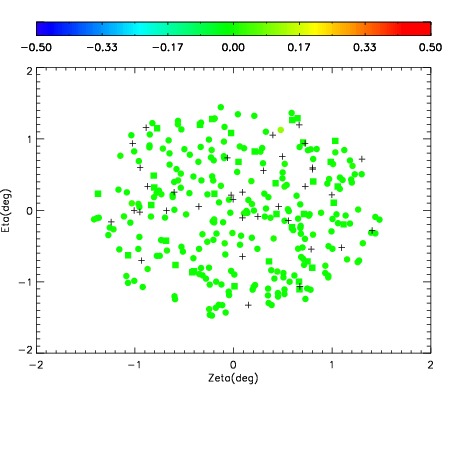
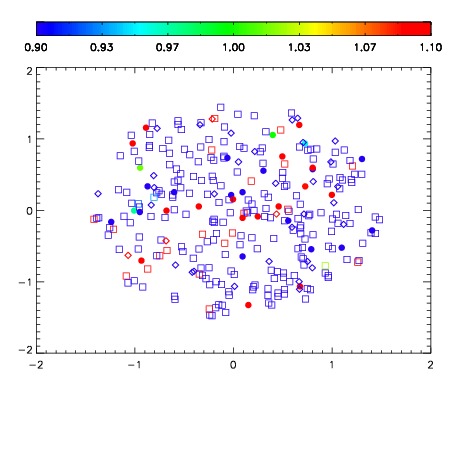
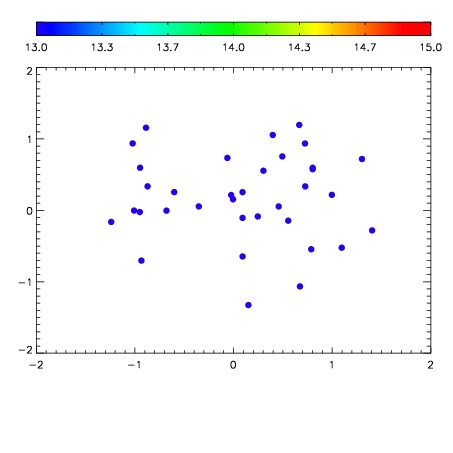

| Frame | Nreads | Zeropoints | Mag plots | Spatial mag deviation | Spatial sky 16325A emission deviations (filled: sky, open: star) | Spatial sky continuum emission | Spatial sky telluric CO2 absorption deviations (filled: H < 10) | |||||||||||||||||||||||
| 0 | 0 |
|
|
|
|
|
|
| IPAIR | NAME | SHIFT | NEWSHIFT | S/N | NAME | SHIFT | NEWSHIFT | S/N |
| 0 | 17310092 | 0.500300 | 0.00000 | 19.2719 | 17310091 | 0.00286627 | 0.497434 | 19.2557 |
| 1 | 17310089 | 0.498547 | 0.00175300 | 19.1988 | 17310090 | 0.00215946 | 0.498141 | 19.2337 |
| 2 | 17310088 | 0.498616 | 0.00168398 | 19.1874 | 17310087 | 0.00000 | 0.500300 | 19.0695 |