| Red | Green | Blue | |
| z | 17.64 | ||
| znorm | Inf | ||
| sky | -Inf | -Inf | -Inf |
| S/N | 26.2 | 45.5 | 46.3 |
| S/N(c) | 0.0 | 0.0 | 0.0 |
| SN(E/C) |
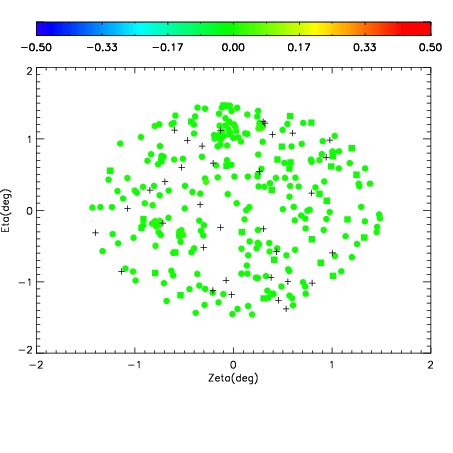
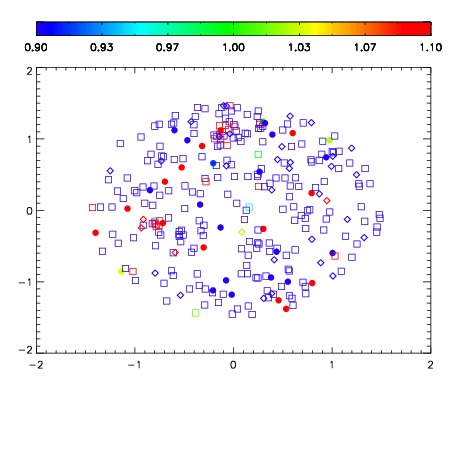


| Frame | Nreads | Zeropoints | Mag plots | Spatial mag deviation | Spatial sky 16325A emission deviations (filled: sky, open: star) | Spatial sky continuum emission | Spatial sky telluric CO2 absorption deviations (filled: H < 10) | |||||||||||||||||||||||
| 0 | 0 |
|
|
|
|
|
|
| IPAIR | NAME | SHIFT | NEWSHIFT | S/N | NAME | SHIFT | NEWSHIFT | S/N |
| 0 | 14880050 | 0.474207 | 0.00000 | 19.1446 | 14880051 | -0.00216068 | 0.476368 | 19.0811 |
| 1 | 14880053 | 0.471543 | 0.00266400 | 19.1606 | 14880052 | -0.00284657 | 0.477054 | 19.1177 |
| 2 | 14880049 | 0.472737 | 0.00147000 | 19.1448 | 14880048 | 0.00000 | 0.474207 | 19.1076 |