| Red | Green | Blue | |
| z | 17.64 | ||
| znorm | Inf | ||
| sky | -NaN | -NaN | -NaN |
| S/N | 26.0 | 46.7 | 50.3 |
| S/N(c) | 0.0 | 0.0 | 0.0 |
| SN(E/C) |

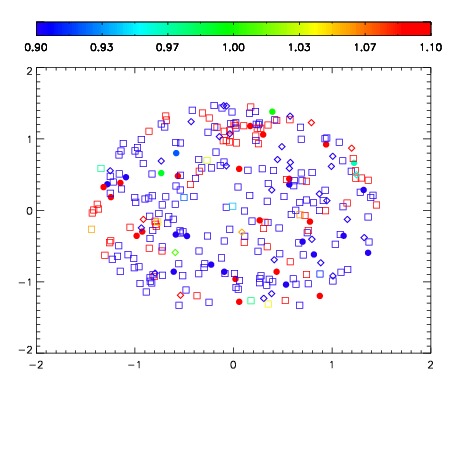
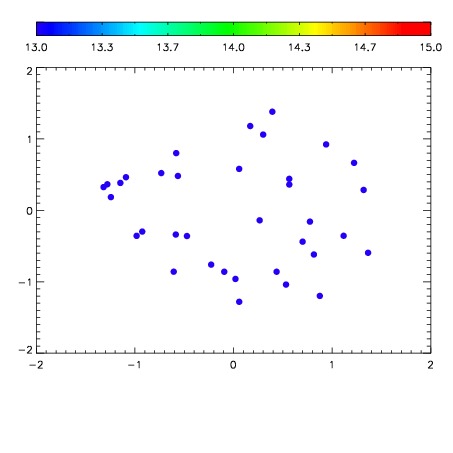

| Frame | Nreads | Zeropoints | Mag plots | Spatial mag deviation | Spatial sky 16325A emission deviations (filled: sky, open: star) | Spatial sky continuum emission | Spatial sky telluric CO2 absorption deviations (filled: H < 10) | |||||||||||||||||||||||
| 0 | 0 |
|
|
|
|
|
|
| IPAIR | NAME | SHIFT | NEWSHIFT | S/N | NAME | SHIFT | NEWSHIFT | S/N |
| 0 | 14670057 | 0.496300 | 0.00000 | 18.9287 | 14670055 | 0.00000 | 0.496300 | 18.8612 |
| 1 | 14670061 | 0.495647 | 0.000652999 | 19.0096 | 14670062 | 0.000159643 | 0.496140 | 19.0512 |
| 2 | 14670060 | 0.494563 | 0.00173700 | 18.9843 | 14670059 | -0.00148608 | 0.497786 | 18.9884 |
| 3 | 14670056 | 0.494828 | 0.00147203 | 18.9377 | 14670058 | -0.00155878 | 0.497859 | 18.9778 |