| Red | Green | Blue | |
| z | 17.64 | ||
| znorm | Inf | ||
| sky | -Inf | -Inf | -NaN |
| S/N | 26.6 | 46.1 | 48.4 |
| S/N(c) | 0.0 | 0.0 | 0.0 |
| SN(E/C) |
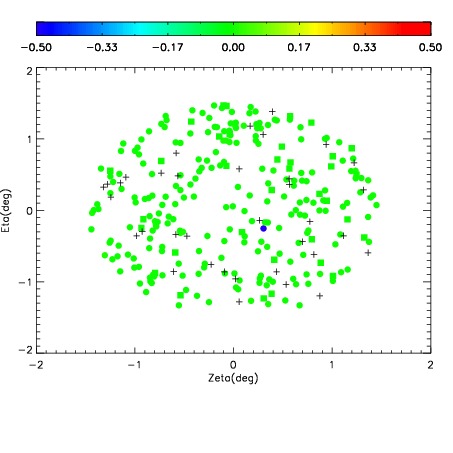
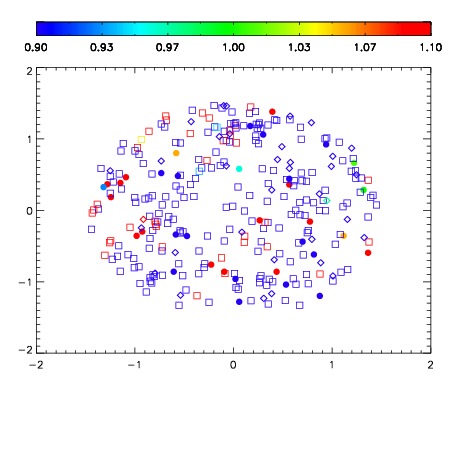
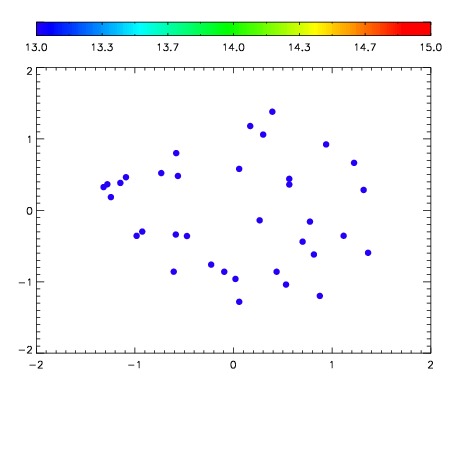

| Frame | Nreads | Zeropoints | Mag plots | Spatial mag deviation | Spatial sky 16325A emission deviations (filled: sky, open: star) | Spatial sky continuum emission | Spatial sky telluric CO2 absorption deviations (filled: H < 10) | |||||||||||||||||||||||
| 0 | 0 |
|
|
|
|
|
|
| IPAIR | NAME | SHIFT | NEWSHIFT | S/N | NAME | SHIFT | NEWSHIFT | S/N |
| 0 | 14940044 | 0.496903 | 0.00000 | 18.8356 | 14940045 | -0.00256629 | 0.499469 | 18.6582 |
| 1 | 14940039 | 0.494710 | 0.00219300 | 18.9741 | 14940038 | 0.00000 | 0.496903 | 18.9912 |
| 2 | 14940040 | 0.495026 | 0.00187701 | 18.9703 | 14940041 | -0.00219897 | 0.499102 | 18.9460 |
| 3 | 14940043 | 0.495870 | 0.00103301 | 18.8723 | 14940042 | -0.00157156 | 0.498475 | 18.8885 |