| Red | Green | Blue | |
| z | 17.64 | ||
| znorm | Inf | ||
| sky | -Inf | -Inf | -Inf |
| S/N | 27.6 | 48.7 | 52.1 |
| S/N(c) | 0.0 | 0.0 | 0.0 |
| SN(E/C) |
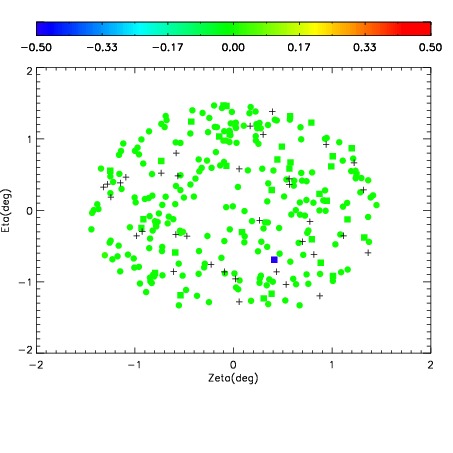
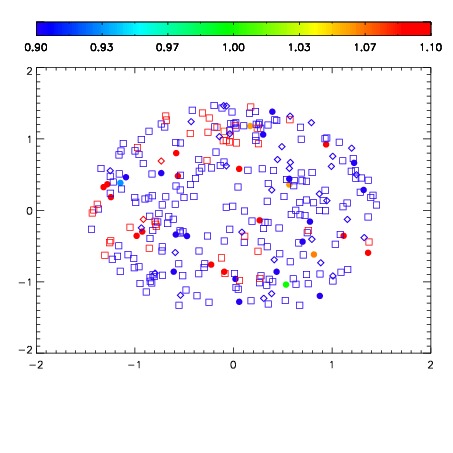
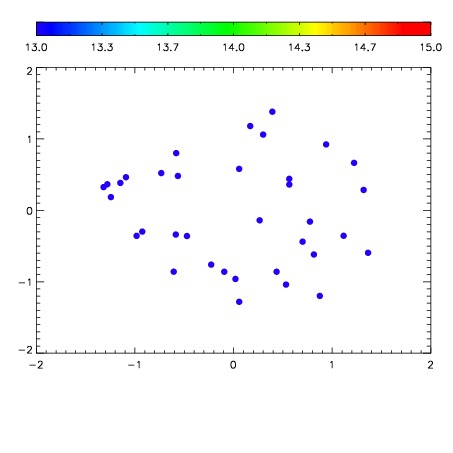

| Frame | Nreads | Zeropoints | Mag plots | Spatial mag deviation | Spatial sky 16325A emission deviations (filled: sky, open: star) | Spatial sky continuum emission | Spatial sky telluric CO2 absorption deviations (filled: H < 10) | |||||||||||||||||||||||
| 0 | 0 |
|
|
|
|
|
|
| IPAIR | NAME | SHIFT | NEWSHIFT | S/N | NAME | SHIFT | NEWSHIFT | S/N |
| 0 | 14970037 | 0.492676 | 0.00000 | 18.9878 | 14970039 | -0.000391650 | 0.493068 | 18.9844 |
| 1 | 14970041 | 0.491466 | 0.00121000 | 19.0573 | 14970043 | -0.00154322 | 0.494219 | 19.0729 |
| 2 | 14970042 | 0.492510 | 0.000165999 | 19.0435 | 14970040 | -0.00125405 | 0.493930 | 19.0399 |
| 3 | 14970038 | 0.492301 | 0.000375003 | 18.9500 | 14970036 | 0.00000 | 0.492676 | 18.9422 |