| Red | Green | Blue | |
| z | 17.64 | ||
| znorm | Inf | ||
| sky | -Inf | -Inf | -NaN |
| S/N | 27.7 | 46.6 | 51.2 |
| S/N(c) | 0.0 | 0.0 | 0.0 |
| SN(E/C) |
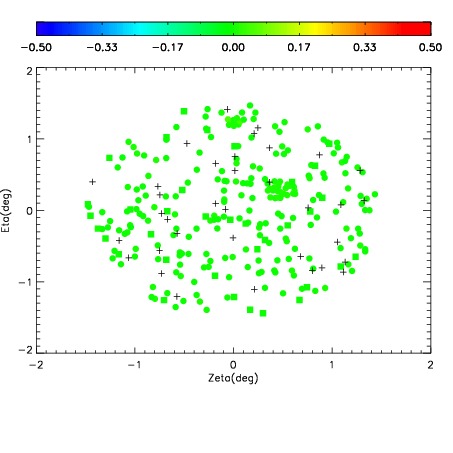
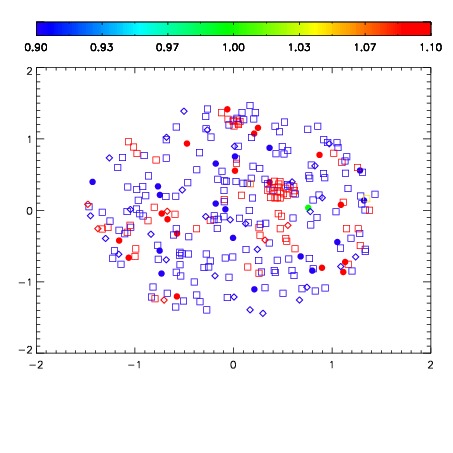
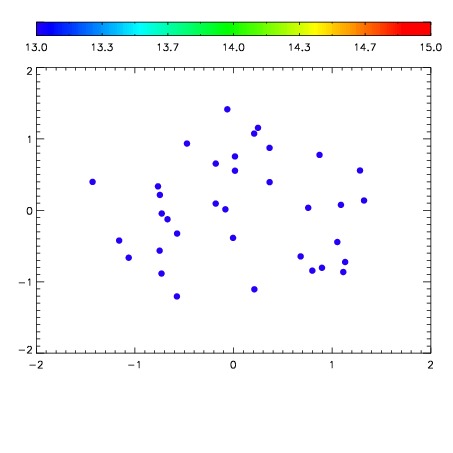

| Frame | Nreads | Zeropoints | Mag plots | Spatial mag deviation | Spatial sky 16325A emission deviations (filled: sky, open: star) | Spatial sky continuum emission | Spatial sky telluric CO2 absorption deviations (filled: H < 10) | |||||||||||||||||||||||
| 0 | 0 |
|
|
|
|
|
|
| IPAIR | NAME | SHIFT | NEWSHIFT | S/N | NAME | SHIFT | NEWSHIFT | S/N |
| 0 | 14060068 | 0.496480 | 0.00000 | 19.1620 | 14060066 | -0.00225986 | 0.498740 | 19.1471 |
| 1 | 14060063 | 0.494791 | 0.00168899 | 19.1607 | 14060065 | -0.00132502 | 0.497805 | 19.1179 |
| 2 | 14060064 | 0.495265 | 0.00121498 | 19.1564 | 14060062 | 0.00000 | 0.496480 | 19.1120 |
| 3 | 14060067 | 0.495169 | 0.00131097 | 19.1230 | 14060069 | -0.000308217 | 0.496788 | 18.6999 |