| Red | Green | Blue | |
| z | 17.64 | ||
| znorm | Inf | ||
| sky | -Inf | -Inf | -NaN |
| S/N | 6.9 | 11.0 | 11.5 |
| S/N(c) | 0.0 | 0.0 | 0.0 |
| SN(E/C) |

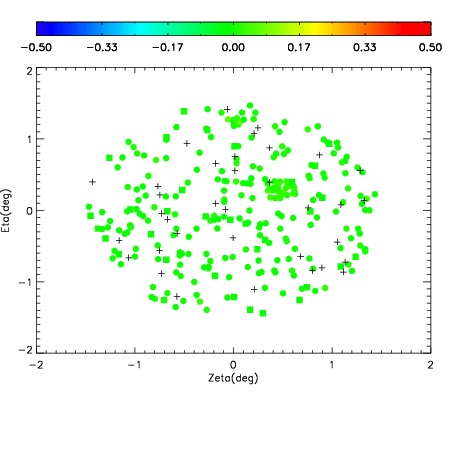
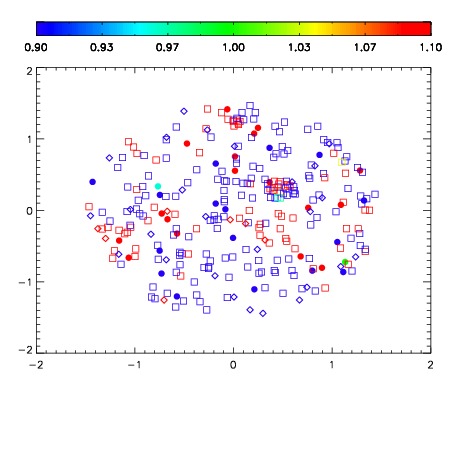


| Frame | Nreads | Zeropoints | Mag plots | Spatial mag deviation | Spatial sky 16325A emission deviations (filled: sky, open: star) | Spatial sky continuum emission | Spatial sky telluric CO2 absorption deviations (filled: H < 10) | |||||||||||||||||||||||
| 0 | 0 |
|
|
|
|
|
|
| IPAIR | NAME | SHIFT | NEWSHIFT | S/N | NAME | SHIFT | NEWSHIFT | S/N |
| 0 | 14350064 | 0.501065 | 0.00000 | 17.7077 | 14350065 | 0.000457986 | 0.500607 | 17.6350 |
| 1 | 14350067 | 0.498542 | 0.00252301 | 17.7778 | 14350066 | 0.000776971 | 0.500288 | 17.9514 |
| 2 | 14350068 | 0.499925 | 0.00114003 | 17.0984 | 14350062 | 0.00000 | 0.501065 | 16.6491 |
| 3 | 14350063 | 0.500196 | 0.000869036 | 17.0377 | 14350069 | 0.000908081 | 0.500157 | 16.5811 |