| Red | Green | Blue | |
| z | 17.64 | ||
| znorm | Inf | ||
| sky | -Inf | -Inf | -Inf |
| S/N | 25.5 | 45.5 | 48.8 |
| S/N(c) | 0.0 | 0.0 | 0.0 |
| SN(E/C) |
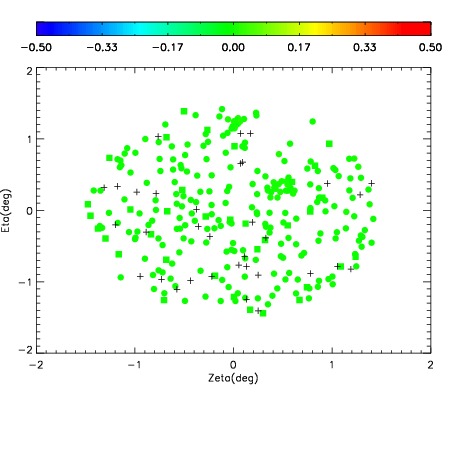
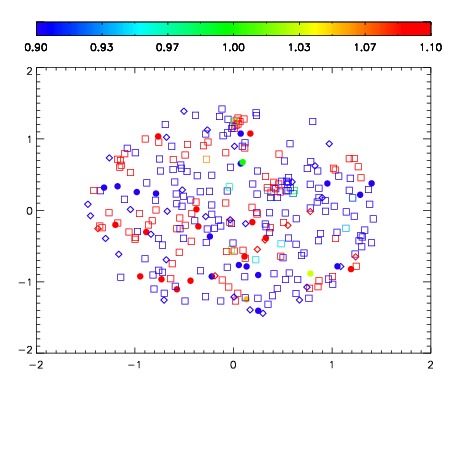
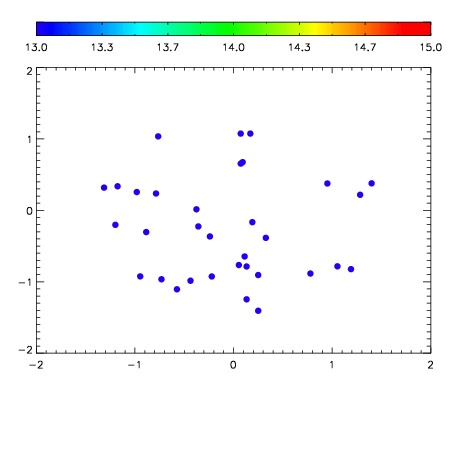

| Frame | Nreads | Zeropoints | Mag plots | Spatial mag deviation | Spatial sky 16325A emission deviations (filled: sky, open: star) | Spatial sky continuum emission | Spatial sky telluric CO2 absorption deviations (filled: H < 10) | |||||||||||||||||||||||
| 0 | 0 |
|
|
|
|
|
|
| IPAIR | NAME | SHIFT | NEWSHIFT | S/N | NAME | SHIFT | NEWSHIFT | S/N |
| 0 | 14670050 | 0.498666 | 0.00000 | 18.9374 | 14670051 | 0.00267555 | 0.495990 | 18.9647 |
| 1 | 14670049 | 0.497705 | 0.000960976 | 18.9230 | 14670047 | 0.000420208 | 0.498246 | 18.9083 |
| 2 | 14670046 | 0.497380 | 0.00128600 | 18.9012 | 14670048 | 0.00126780 | 0.497398 | 18.8643 |
| 3 | 14670045 | 0.497204 | 0.00146198 | 18.8581 | 14670044 | 0.00000 | 0.498666 | 18.7239 |