| Red | Green | Blue | |
| z | 17.64 | ||
| znorm | Inf | ||
| sky | -Inf | -NaN | -NaN |
| S/N | 27.3 | 46.1 | 53.7 |
| S/N(c) | 0.0 | 0.0 | 0.0 |
| SN(E/C) |
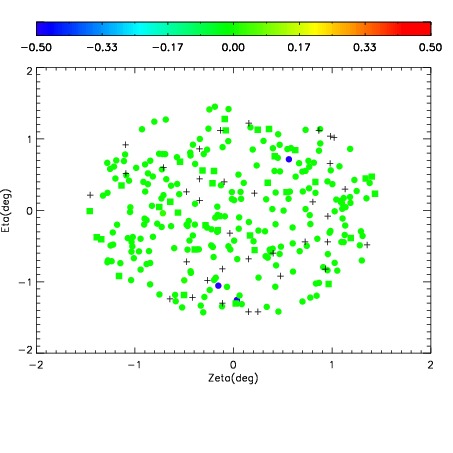
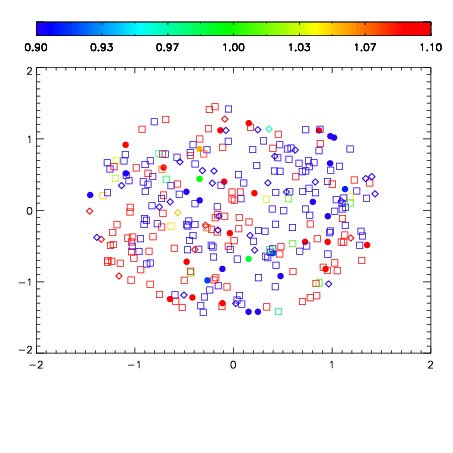


| Frame | Nreads | Zeropoints | Mag plots | Spatial mag deviation | Spatial sky 16325A emission deviations (filled: sky, open: star) | Spatial sky continuum emission | Spatial sky telluric CO2 absorption deviations (filled: H < 10) | |||||||||||||||||||||||
| 0 | 0 |
|
|
|
|
|
|
| IPAIR | NAME | SHIFT | NEWSHIFT | S/N | NAME | SHIFT | NEWSHIFT | S/N |
| 0 | 17880050 | 0.509438 | 0.00000 | 19.0106 | 17880051 | 0.00221065 | 0.507227 | 19.0399 |
| 1 | 17880053 | 0.508327 | 0.00111097 | 19.1100 | 17880055 | 0.00424234 | 0.505196 | 19.0821 |
| 2 | 17880054 | 0.509046 | 0.000391960 | 19.0594 | 17880048 | 0.00000 | 0.509438 | 19.0674 |
| 3 | 17880049 | 0.509008 | 0.000429988 | 18.9887 | 17880052 | 0.00217644 | 0.507262 | 18.8845 |