| Red | Green | Blue | |
| z | 17.64 | ||
| znorm | Inf | ||
| sky | -NaN | -Inf | -Inf |
| S/N | 20.7 | 35.8 | 42.3 |
| S/N(c) | 0.0 | 0.0 | 0.0 |
| SN(E/C) |
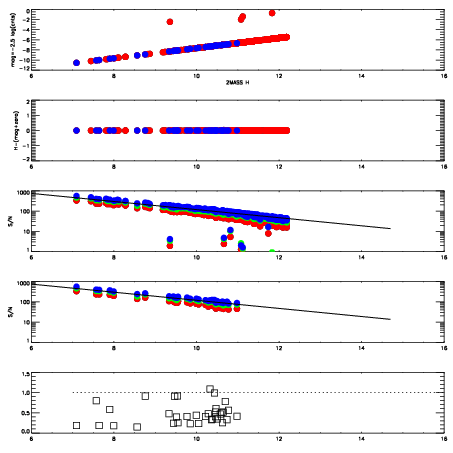
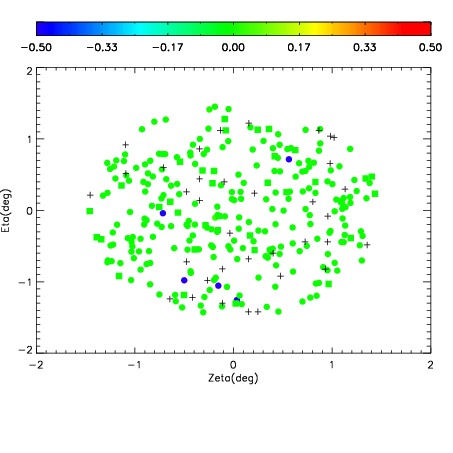
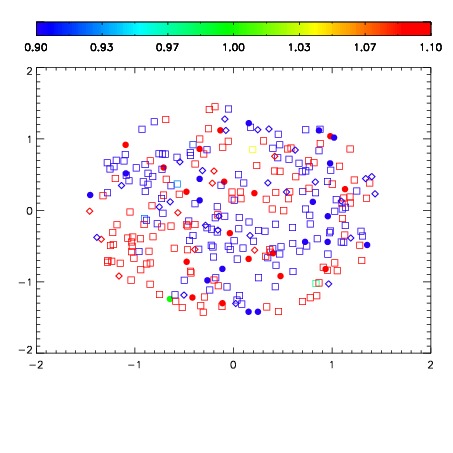
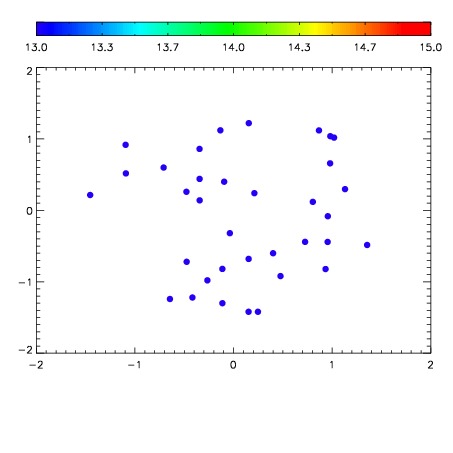

| Frame | Nreads | Zeropoints | Mag plots | Spatial mag deviation | Spatial sky 16325A emission deviations (filled: sky, open: star) | Spatial sky continuum emission | Spatial sky telluric CO2 absorption deviations (filled: H < 10) | |||||||||||||||||||||||
| 0 | 0 |
|
|
|
|
|
|
| IPAIR | NAME | SHIFT | NEWSHIFT | S/N | NAME | SHIFT | NEWSHIFT | S/N |
| 0 | 18470017 | 0.507145 | 0.00000 | 18.7857 | 18470018 | 0.00495947 | 0.502186 | 18.8552 |
| 1 | 18470016 | 0.506375 | 0.000769973 | 18.6420 | 18470011 | 0.00000 | 0.507145 | 18.6123 |
| 2 | 18470013 | 0.505271 | 0.00187397 | 18.5742 | 18470015 | 0.00275162 | 0.504393 | 18.5712 |
| 3 | 18470012 | 0.505037 | 0.00210798 | 18.5597 | 18470014 | 0.00164671 | 0.505498 | 18.5224 |