| Red | Green | Blue | |
| z | 17.64 | ||
| znorm | Inf | ||
| sky | -Inf | -Inf | -Inf |
| S/N | 13.6 | 24.0 | 27.3 |
| S/N(c) | 5.8 | 17.0 | 33.1 |
| SN(E/C) |
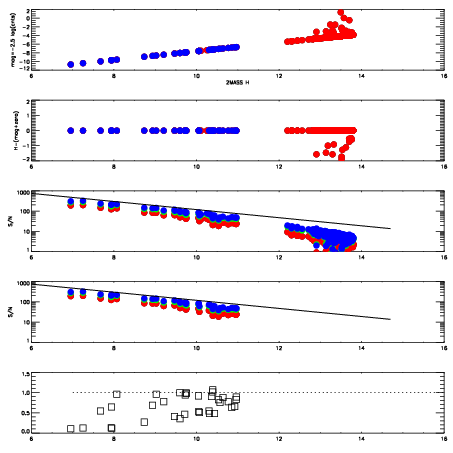
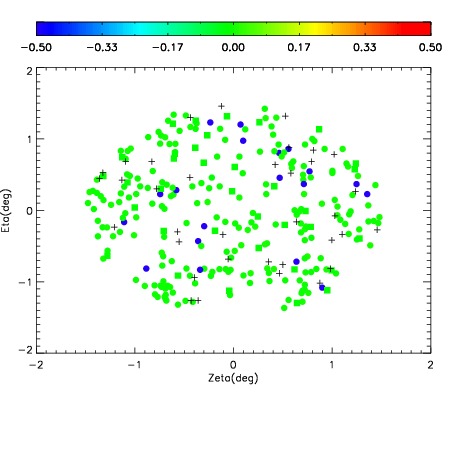
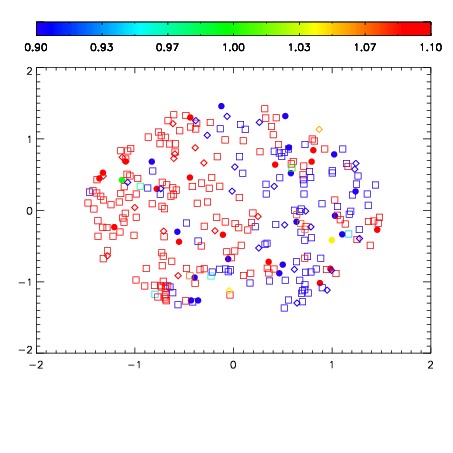
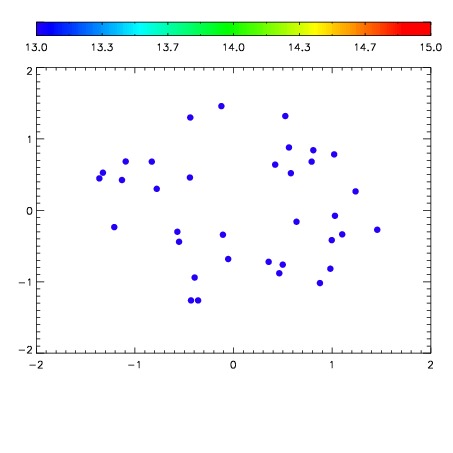

| Frame | Nreads | Zeropoints | Mag plots | Spatial mag deviation | Spatial sky 16325A emission deviations (filled: sky, open: star) | Spatial sky continuum emission | Spatial sky telluric CO2 absorption deviations (filled: H < 10) | |||||||||||||||||||||||
| 0 | 0 |
|
|
|
|
|
|
| IPAIR | NAME | SHIFT | NEWSHIFT | S/N | NAME | SHIFT | NEWSHIFT | S/N |
| 0 | 14350080 | 0.499915 | 0.00000 | 17.8109 | 14350081 | 0.00142298 | 0.498492 | 17.7861 |
| 1 | 14350083 | 0.498344 | 0.00157100 | 17.9889 | 14350082 | 0.00143453 | 0.498480 | 18.0407 |
| 2 | 14350084 | 0.499026 | 0.000889003 | 17.7821 | 14350085 | 0.00253417 | 0.497381 | 17.1544 |
| 3 | 14350079 | 0.498888 | 0.00102702 | 17.2982 | 14350078 | 0.00000 | 0.499915 | 17.0442 |