| Red | Green | Blue | |
| z | 17.64 | ||
| znorm | Inf | ||
| sky | -NaN | -NaN | -NaN |
| S/N | 30.7 | 48.9 | 54.4 |
| S/N(c) | 12.4 | 39.7 | 56.1 |
| SN(E/C) |
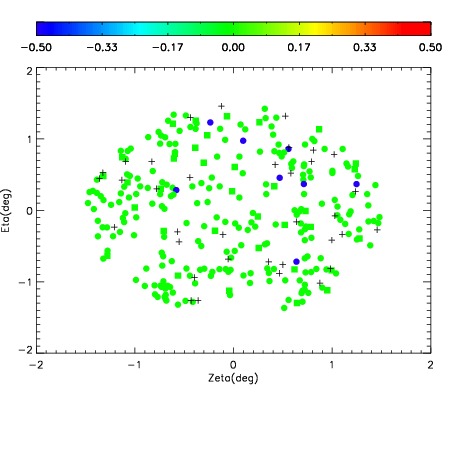
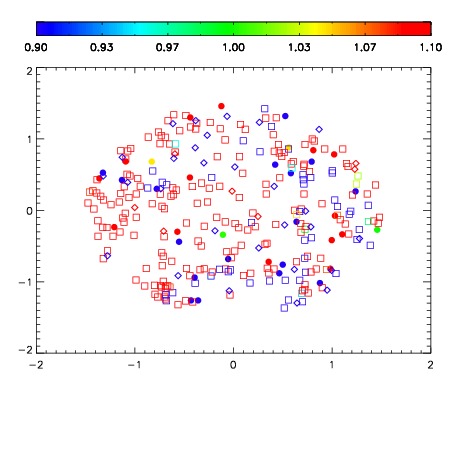
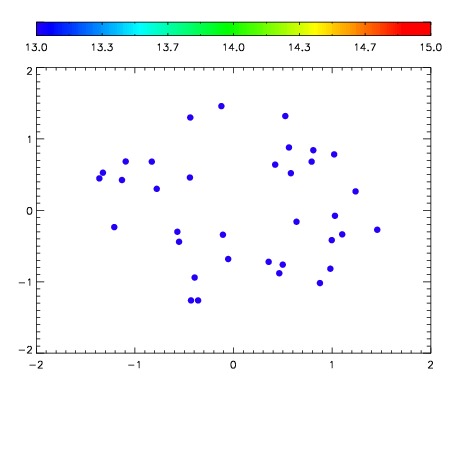

| Frame | Nreads | Zeropoints | Mag plots | Spatial mag deviation | Spatial sky 16325A emission deviations (filled: sky, open: star) | Spatial sky continuum emission | Spatial sky telluric CO2 absorption deviations (filled: H < 10) | |||||||||||||||||||||||
| 0 | 0 |
|
|
|
|
|
|
| IPAIR | NAME | SHIFT | NEWSHIFT | S/N | NAME | SHIFT | NEWSHIFT | S/N |
| 0 | 14420046 | 0.498980 | 0.00000 | 18.8539 | 14420048 | -0.000573332 | 0.499553 | 18.8946 |
| 1 | 14420050 | 0.498892 | 8.79765e-05 | 18.9555 | 14420051 | 1.84280e-06 | 0.498978 | 18.9778 |
| 2 | 14420049 | 0.498789 | 0.000190973 | 18.8819 | 14420047 | -9.39213e-05 | 0.499074 | 18.9431 |
| 3 | 14420045 | 0.498045 | 0.000934988 | 18.6125 | 14420044 | 0.00000 | 0.498980 | 18.8260 |