| Frame | Nreads | Zeropoints | Mag plots
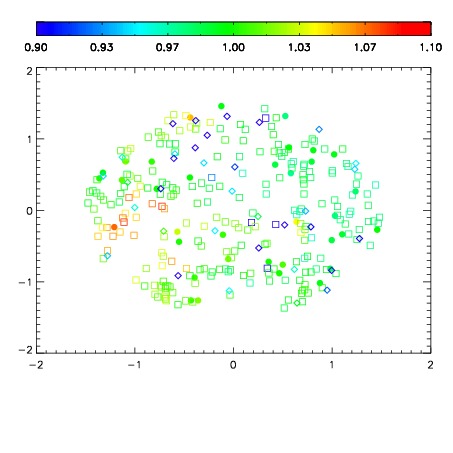
| Spatial mag deviation
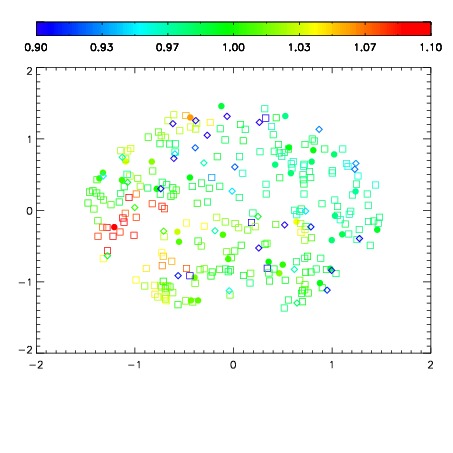
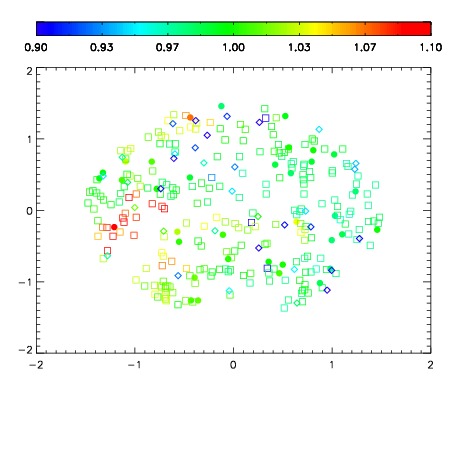
| Spatial sky 16325A emission deviations (filled: sky, open: star)
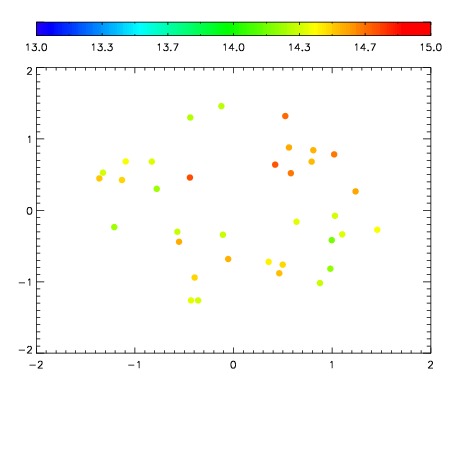
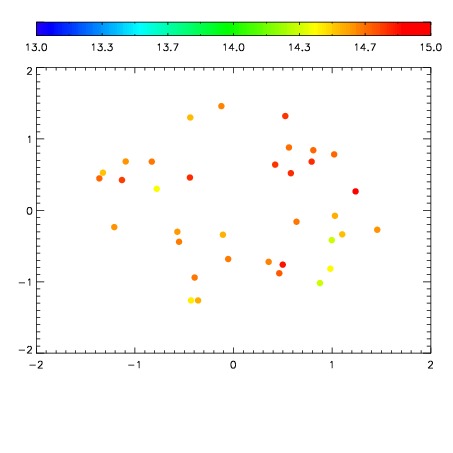
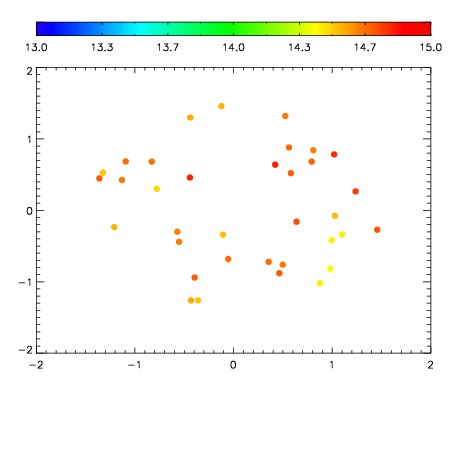
| Spatial sky continuum emission
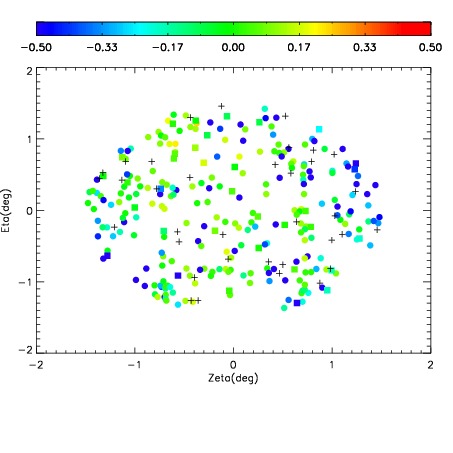
| Spatial sky telluric CO2 absorption deviations (filled: H < 10)
|
| 14950061
| 47
| | Red | Green | Blue
| | z | | 19.06
| | znorm | | 14.88
| | sky | 14.6 | 14.4 | 14.7
| | S/N | 19.0 | 28.5 | 31.7
| | S/N(c) | 6.7 | 20.5 | 8.6
| | SN(E/C) 0.59
|
| 
| 
| 
| 
| 
|
| 14950062
| 47
| | Red | Green | Blue
| | z | | 19.07
| | znorm | | 14.89
| | sky | 14.8 | 14.5 | 14.7
| | S/N | 18.8 | 28.2 | 31.4
| | S/N(c) | 6.7 | 20.4 | 8.6
| | SN(E/C) 0.55
|
| 
| 
| 
| 
| 
|
| 14950063
| 47
| | Red | Green | Blue
| | z | | 19.12
| | znorm | | 14.94
| | sky | 14.8 | 14.7 | 14.8
| | S/N | 19.2 | 29.0 | 32.2
| | S/N(c) | 6.8 | 20.9 | 8.6
| | SN(E/C) 0.58
|
| 
| 
| 
| 
| 
|
| 14950064
| 47
| | Red | Green | Blue
| | z | | 19.12
| | znorm | | 14.94
| | sky | 14.7 | 14.7 | 14.7
| | S/N | 19.3 | 29.0 | 32.3
| | S/N(c) | 6.9 | 21.0 | 8.7
| | SN(E/C) 0.59
|
| 
| 
| 
| 
| 
|