| Red | Green | Blue | |
| z | 17.64 | ||
| znorm | Inf | ||
| sky | -NaN | -Inf | -Inf |
| S/N | 25.3 | 39.6 | 43.9 |
| S/N(c) | 9.4 | 27.7 | 11.5 |
| SN(E/C) |
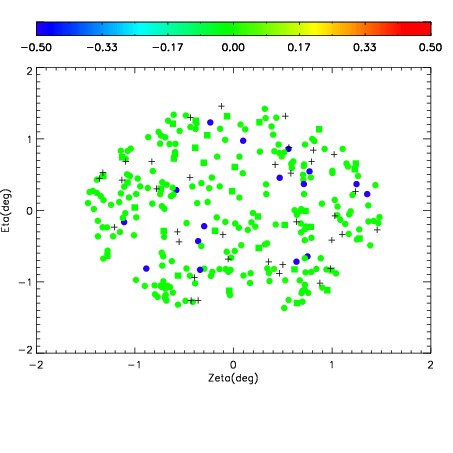
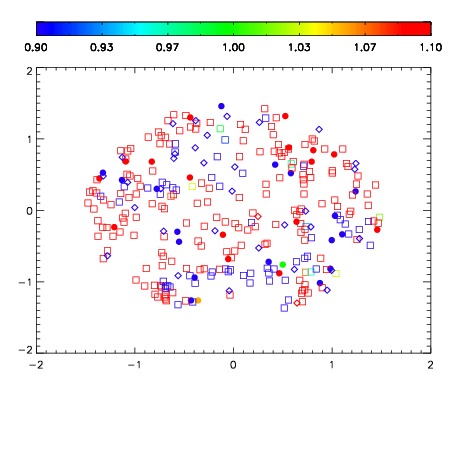


| Frame | Nreads | Zeropoints | Mag plots | Spatial mag deviation | Spatial sky 16325A emission deviations (filled: sky, open: star) | Spatial sky continuum emission | Spatial sky telluric CO2 absorption deviations (filled: H < 10) | |||||||||||||||||||||||
| 0 | 0 |
|
|
|
|
|
|
| IPAIR | NAME | SHIFT | NEWSHIFT | S/N | NAME | SHIFT | NEWSHIFT | S/N |
| 0 | 14950063 | 0.500470 | 0.00000 | 19.0888 | 14950064 | 0.00107128 | 0.499399 | 19.0924 |
| 1 | 14950062 | 0.499785 | 0.000684977 | 19.0450 | 14950061 | 0.00000 | 0.500470 | 19.0381 |