| Frame | Nreads | Zeropoints | Mag plots
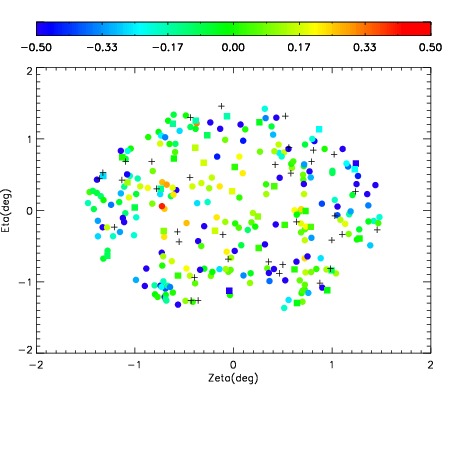
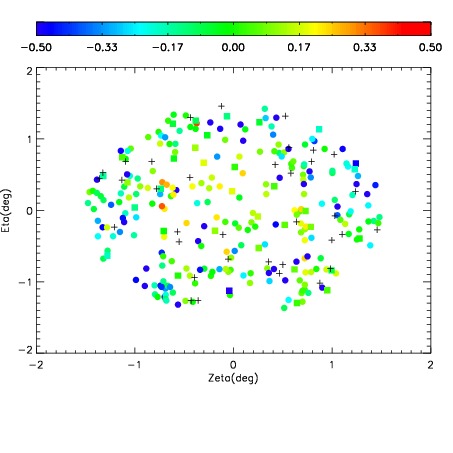
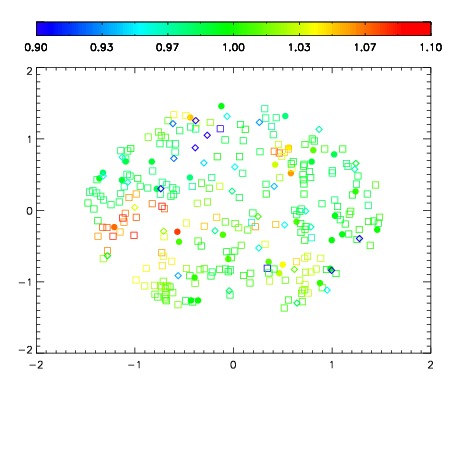
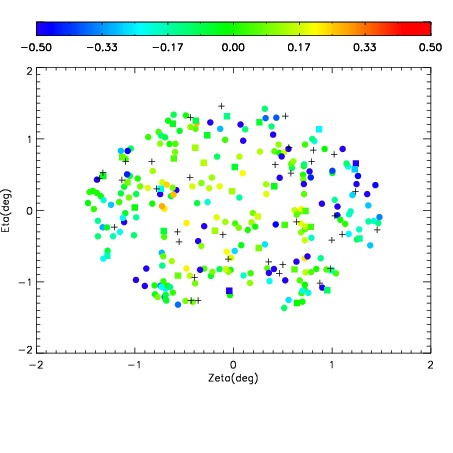
| Spatial mag deviation
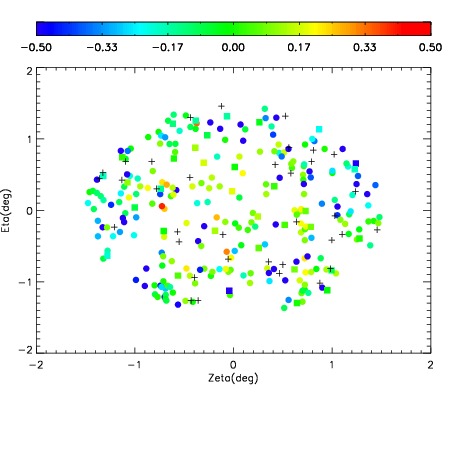
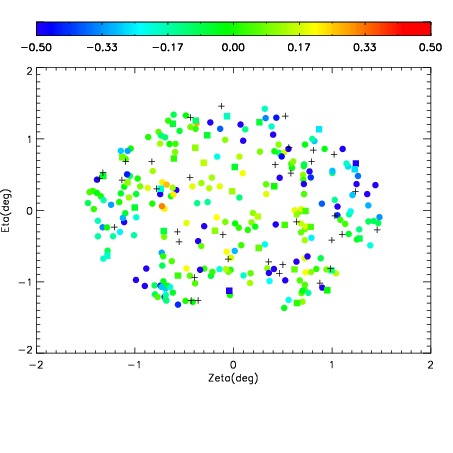
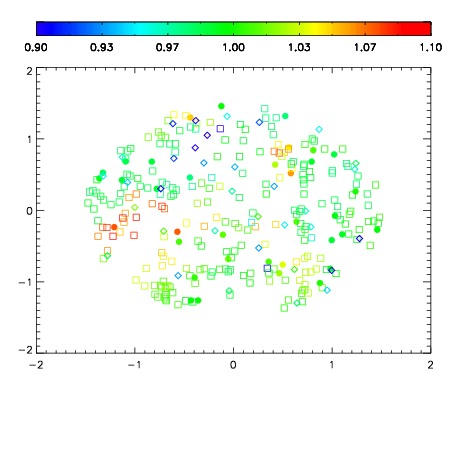
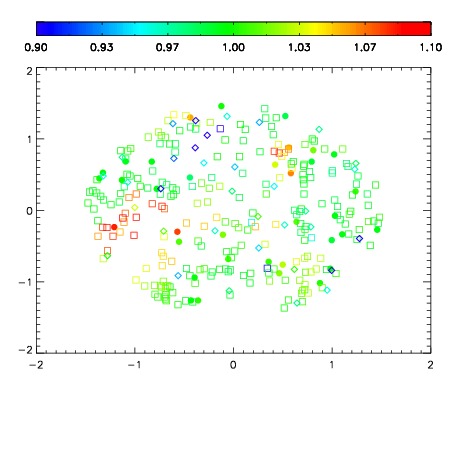
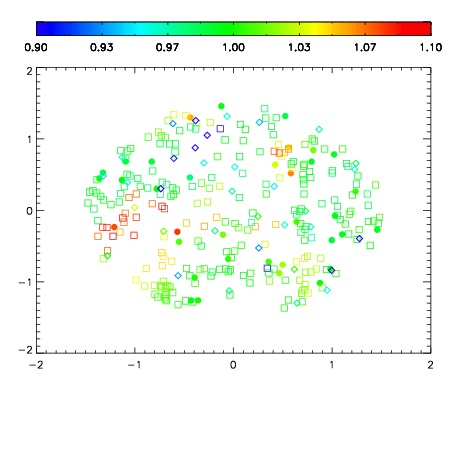
| Spatial sky 16325A emission deviations (filled: sky, open: star)
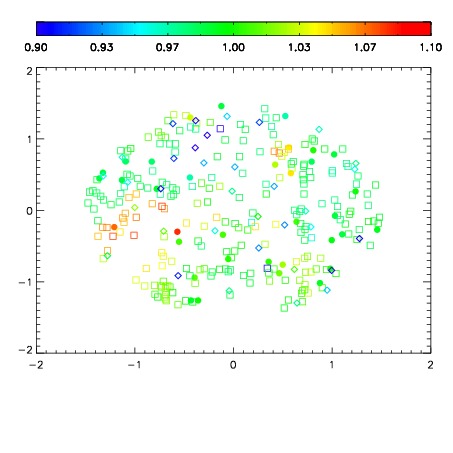
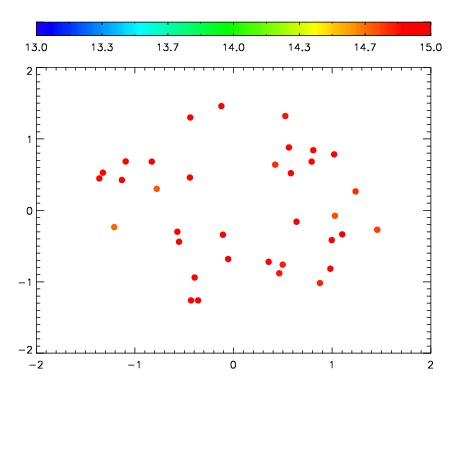
| Spatial sky continuum emission
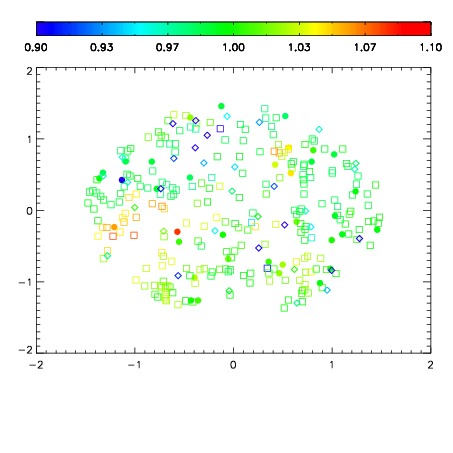
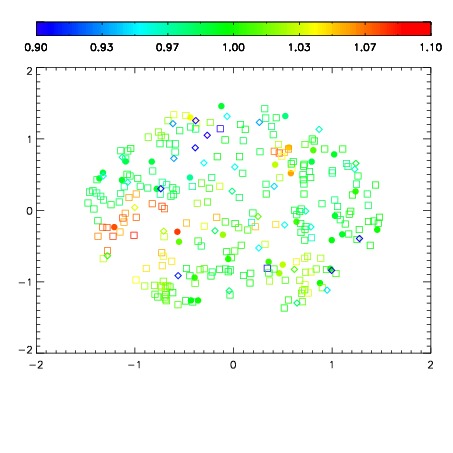
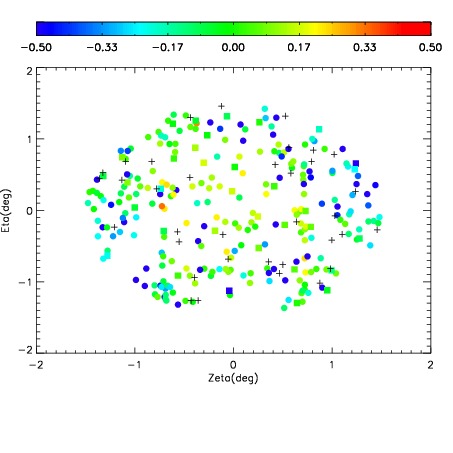
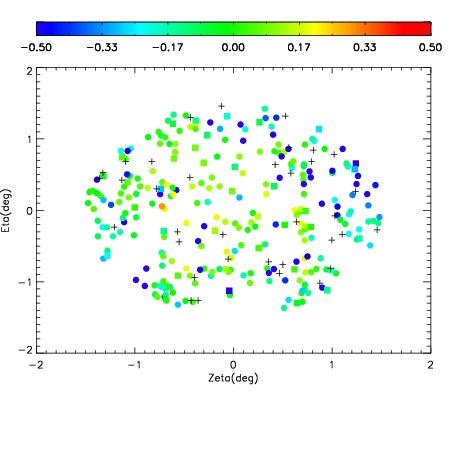
| Spatial sky telluric CO2 absorption deviations (filled: H < 10)
|
| 15000022
| 47
| | Red | Green | Blue
| | z | | 18.93
| | znorm | | 14.75
| | sky | 14.8 | 14.5 | 14.8
| | S/N | 18.9 | 28.1 | 30.9
| | S/N(c) | 10.5 | 9.9 | 33.0
| | SN(E/C) 0.62
|
| 
| 
| 
| 
| 
|
| 15000023
| 47
| | Red | Green | Blue
| | z | | 18.96
| | znorm | | 14.78
| | sky | 15.0 | 14.8 | 14.9
| | S/N | 18.9 | 28.3 | 31.3
| | S/N(c) | 10.6 | 10.0 | 33.8
| | SN(E/C) 0.60
|
| 
| 
| 
| 
| 
|
| 15000024
| 47
| | Red | Green | Blue
| | z | | 18.74
| | znorm | | 14.56
| | sky | 15.0 | 14.8 | 14.9
| | S/N | 16.8 | 25.4 | 27.6
| | S/N(c) | 9.6 | 9.1 | 30.0
| | SN(E/C) 0.64
|
| 
| 
| 
| 
| 
|
| 15000025
| 47
| | Red | Green | Blue
| | z | | 18.84
| | znorm | | 14.66
| | sky | 14.9 | 15.0 | 14.9
| | S/N | 17.0 | 25.9 | 28.2
| | S/N(c) | 9.8 | 9.3 | 31.0
| | SN(E/C) 0.61
|
| 
| 
| 
| 
| 
|
| 15000026
| 47
| | Red | Green | Blue
| | z | | 18.97
| | znorm | | 14.79
| | sky | 15.1 | 14.8 | 14.9
| | S/N | 18.8 | 28.2 | 30.9
| | S/N(c) | 10.8 | 10.1 | 33.3
| | SN(E/C) 0.62
|
| 
| 
| 
| 
| 
|
| 15000027
| 47
| | Red | Green | Blue
| | z | | 18.88
| | znorm | | 14.70
| | sky | 15.1 | 14.9 | 14.8
| | S/N | 17.5 | 26.5 | 28.9
| | S/N(c) | 10.1 | 9.5 | 31.6
| | SN(E/C) 0.62
|
| 
| 
| 
| 
| 
|
| 15000028
| 47
| | Red | Green | Blue
| | z | | 18.95
| | znorm | | 14.77
| | sky | 14.8 | 14.9 | 14.9
| | S/N | 17.7 | 26.7 | 29.2
| | S/N(c) | 10.2 | 9.6 | 31.8
| | SN(E/C) 0.59
|
| 
| 
| 
| 
| 
|
| 15000029
| 47
| | Red | Green | Blue
| | z | | 18.95
| | znorm | | 14.77
| | sky | 14.9 | 14.8 | 15.0
| | S/N | 18.2 | 27.2 | 29.8
| | S/N(c) | 10.4 | 9.7 | 32.4
| | SN(E/C) 0.60
|
| 
| 
| 
| 
| 
|