| Red | Green | Blue | |
| z | 17.64 | ||
| znorm | Inf | ||
| sky | -Inf | -Inf | -NaN |
| S/N | 33.2 | 52.3 | 57.2 |
| S/N(c) | 20.5 | 19.2 | 63.7 |
| SN(E/C) |
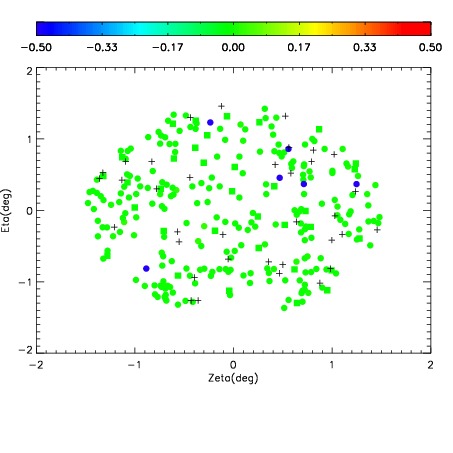


| Frame | Nreads | Zeropoints | Mag plots | Spatial mag deviation | Spatial sky 16325A emission deviations (filled: sky, open: star) | Spatial sky continuum emission | Spatial sky telluric CO2 absorption deviations (filled: H < 10) | |||||||||||||||||||||||
| 0 | 0 |
|
|
|
|
|
|
| IPAIR | NAME | SHIFT | NEWSHIFT | S/N | NAME | SHIFT | NEWSHIFT | S/N |
| 0 | 15000028 | 0.497680 | 0.00000 | 18.9270 | 15000026 | 0.000357140 | 0.497323 | 18.9316 |
| 1 | 15000023 | 0.496762 | 0.000918001 | 18.9320 | 15000029 | 0.000852889 | 0.496827 | 18.9433 |
| 2 | 15000027 | 0.497281 | 0.000399023 | 18.8532 | 15000022 | 0.00000 | 0.497680 | 18.9149 |
| 3 | 15000024 | 0.497290 | 0.000390023 | 18.6982 | 15000025 | 0.000577640 | 0.497102 | 18.8061 |