| Red | Green | Blue | |
| z | 17.64 | ||
| znorm | Inf | ||
| sky | -NaN | -Inf | -NaN |
| S/N | 28.0 | 45.2 | 50.3 |
| S/N(c) | 10.2 | 40.6 | 53.9 |
| SN(E/C) |
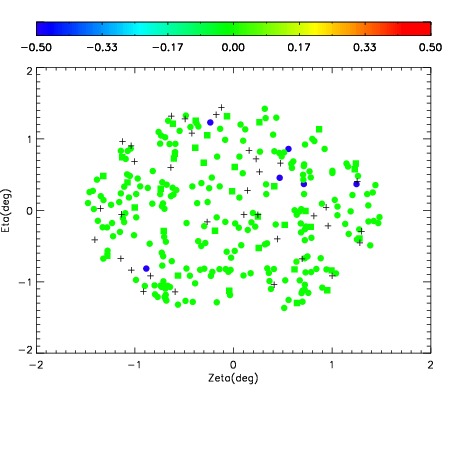
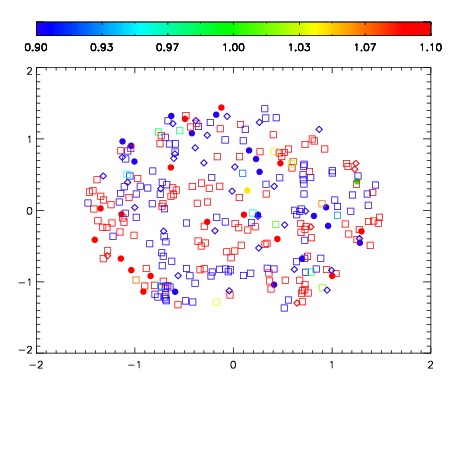
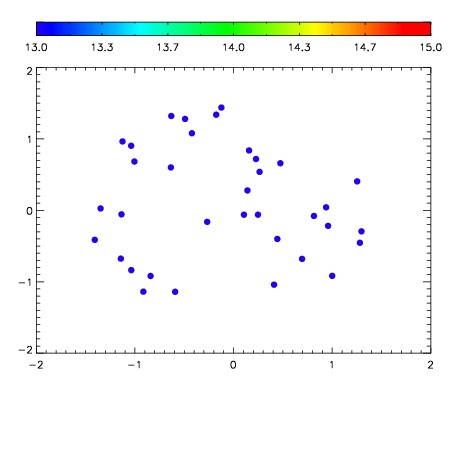

| Frame | Nreads | Zeropoints | Mag plots | Spatial mag deviation | Spatial sky 16325A emission deviations (filled: sky, open: star) | Spatial sky continuum emission | Spatial sky telluric CO2 absorption deviations (filled: H < 10) | |||||||||||||||||||||||
| 0 | 0 |
|
|
|
|
|
|
| IPAIR | NAME | SHIFT | NEWSHIFT | S/N | NAME | SHIFT | NEWSHIFT | S/N |
| 0 | 14370056 | 0.499099 | 0.00000 | 17.3290 | 14370054 | 0.00168732 | 0.497412 | 18.6104 |
| 1 | 14370052 | 0.498935 | 0.000163972 | 18.9033 | 14370053 | 0.000786407 | 0.498313 | 18.8753 |
| 2 | 14370051 | 0.497838 | 0.00126100 | 18.7967 | 14370057 | 0.00214308 | 0.496956 | 18.7441 |
| 3 | 14370055 | 0.497895 | 0.00120398 | 18.7399 | 14370050 | 0.00000 | 0.499099 | 18.7215 |