| Red | Green | Blue | |
| z | 17.64 | ||
| znorm | Inf | ||
| sky | -Inf | -Inf | -NaN |
| S/N | 25.6 | 42.8 | 46.2 |
| S/N(c) | 28.2 | 15.2 | 13.0 |
| SN(E/C) |
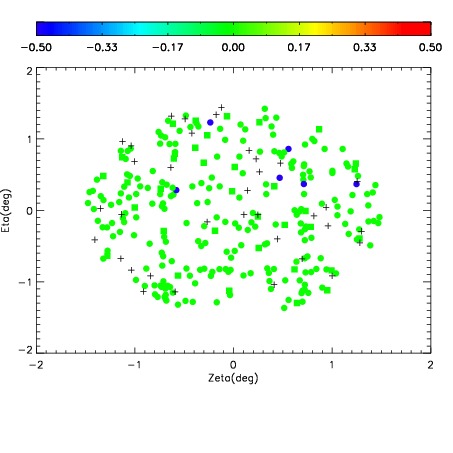
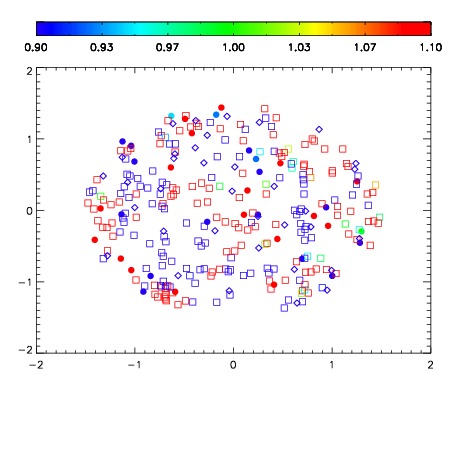
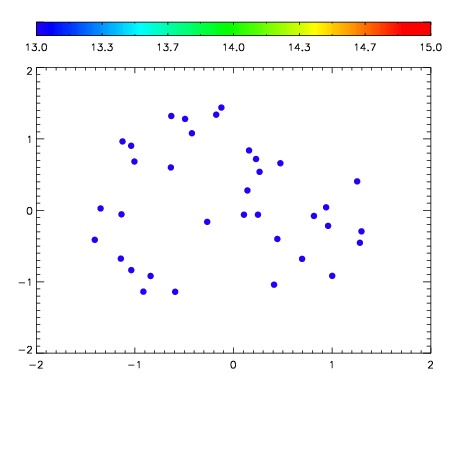

| Frame | Nreads | Zeropoints | Mag plots | Spatial mag deviation | Spatial sky 16325A emission deviations (filled: sky, open: star) | Spatial sky continuum emission | Spatial sky telluric CO2 absorption deviations (filled: H < 10) | |||||||||||||||||||||||
| 0 | 0 |
|
|
|
|
|
|
| IPAIR | NAME | SHIFT | NEWSHIFT | S/N | NAME | SHIFT | NEWSHIFT | S/N |
| 0 | 14440066 | 0.500714 | 0.00000 | 18.5844 | 14440064 | -0.000206400 | 0.500920 | 18.7069 |
| 1 | 14440065 | 0.500014 | 0.000699997 | 18.5695 | 14440063 | -0.000750508 | 0.501464 | 18.7022 |
| 2 | 14440061 | 0.498258 | 0.00245601 | 18.4884 | 14440067 | 0.000606120 | 0.500108 | 18.5748 |
| 3 | 14440062 | 0.499137 | 0.00157699 | 18.3751 | 14440060 | 0.00000 | 0.500714 | 18.3427 |