| Red | Green | Blue | |
| z | 17.63 | ||
| znorm | Inf | ||
| sky | -NaN | -NaN | -NaN |
| S/N | 36.4 | 57.0 | 63.1 |
| S/N(c) | 13.4 | 13.9 | 46.4 |
| SN(E/C) |
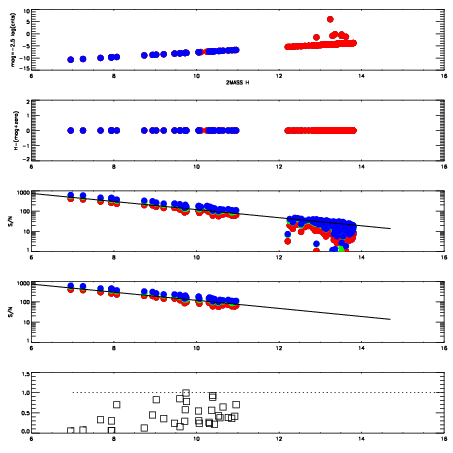
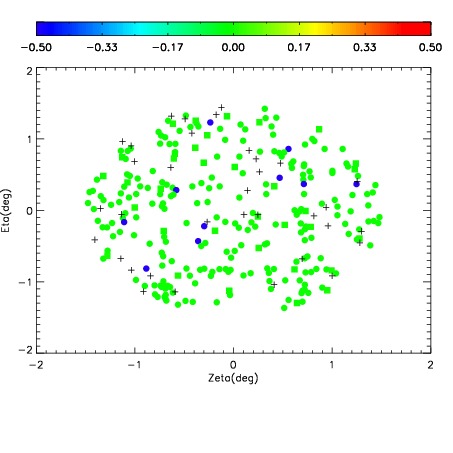
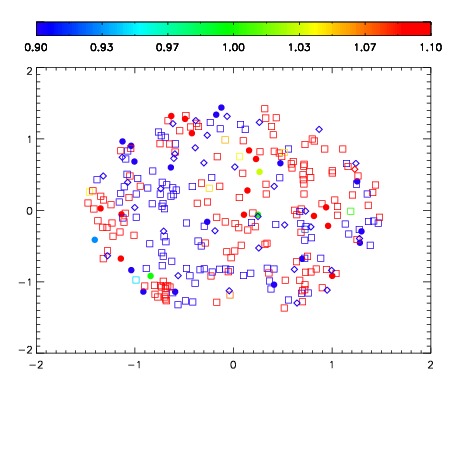


| Frame | Nreads | Zeropoints | Mag plots | Spatial mag deviation | Spatial sky 16325A emission deviations (filled: sky, open: star) | Spatial sky continuum emission | Spatial sky telluric CO2 absorption deviations (filled: H < 10) | |||||||||||||||||||||||
| 0 | 0 |
|
|
|
|
|
|
| IPAIR | NAME | SHIFT | NEWSHIFT | S/N | NAME | SHIFT | NEWSHIFT | S/N |
| 0 | 15810019 | 0.485345 | 0.00000 | 19.0971 | 15810020 | -0.000813798 | 0.486159 | 19.1020 |
| 1 | 15810018 | 0.484694 | 0.000651002 | 19.1236 | 15810017 | -0.000353315 | 0.485698 | 19.1296 |
| 2 | 15810015 | 0.484729 | 0.000616014 | 19.0727 | 15810016 | -0.000225147 | 0.485570 | 19.0986 |
| 3 | 15810014 | 0.483931 | 0.00141400 | 19.0689 | 15810013 | 0.00000 | 0.485345 | 18.9922 |