| Red | Green | Blue | |
| z | 17.64 | ||
| znorm | Inf | ||
| sky | -NaN | -Inf | -NaN |
| S/N | 40.0 | 62.6 | 75.9 |
| S/N(c) | 14.8 | 65.8 | 19.0 |
| SN(E/C) |
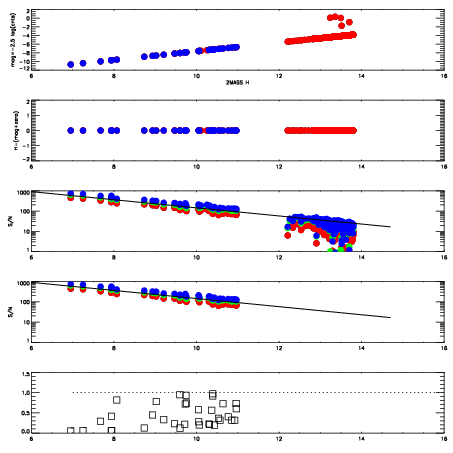
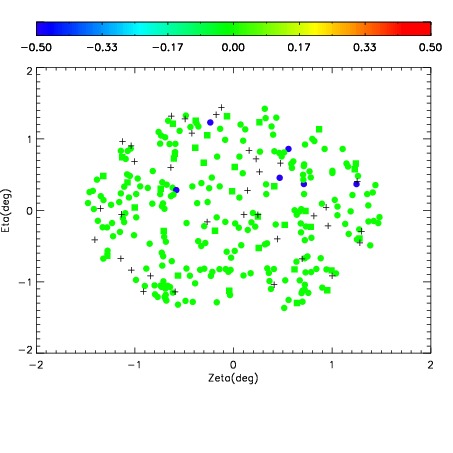
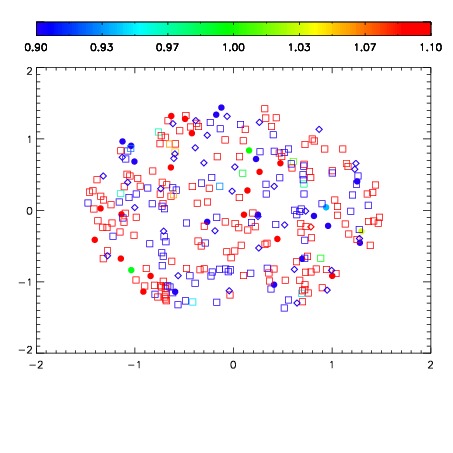


| Frame | Nreads | Zeropoints | Mag plots | Spatial mag deviation | Spatial sky 16325A emission deviations (filled: sky, open: star) | Spatial sky continuum emission | Spatial sky telluric CO2 absorption deviations (filled: H < 10) | |||||||||||||||||||||||
| 0 | 0 |
|
|
|
|
|
|
| IPAIR | NAME | SHIFT | NEWSHIFT | S/N | NAME | SHIFT | NEWSHIFT | S/N |
| 0 | 17940060 | 0.000875174 | 0.00000 | 18.9202 | 17940061 | -0.500904 | 0.501779 | 18.9300 |
| 1 | 17940063 | -0.00229104 | 0.00316621 | 18.9876 | 17940062 | -0.501203 | 0.502078 | 18.9935 |
| 2 | 17940056 | 0.000595042 | 0.000280132 | 18.8875 | 17940053 | -0.501657 | 0.502532 | 18.8822 |
| 3 | 17940055 | 0.000470563 | 0.000404611 | 18.8756 | 17940054 | -0.501596 | 0.502471 | 18.8738 |
| 4 | 17940059 | 0.000287529 | 0.000587645 | 18.8459 | 17940058 | -0.503605 | 0.504480 | 18.7946 |
| 5 | 17940052 | 0.00000 | 0.000875174 | 18.8442 | 17940057 | -0.503412 | 0.504287 | 18.7157 |