| Red | Green | Blue | |
| z | 17.64 | ||
| znorm | Inf | ||
| sky | -NaN | -NaN | -NaN |
| S/N | 33.9 | 53.8 | 63.5 |
| S/N(c) | 12.5 | 56.6 | 16.9 |
| SN(E/C) |
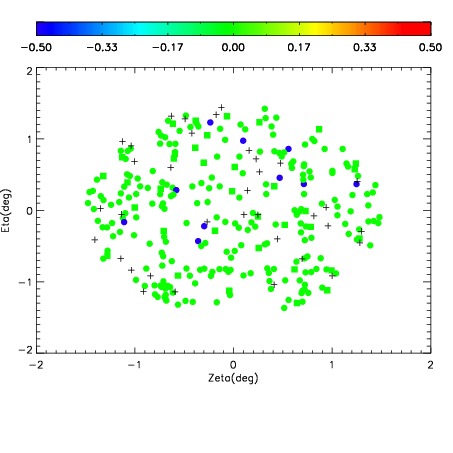

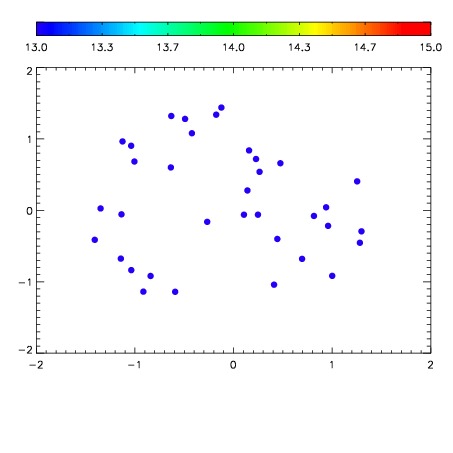

| Frame | Nreads | Zeropoints | Mag plots | Spatial mag deviation | Spatial sky 16325A emission deviations (filled: sky, open: star) | Spatial sky continuum emission | Spatial sky telluric CO2 absorption deviations (filled: H < 10) | |||||||||||||||||||||||
| 0 | 0 |
|
|
|
|
|
|
| IPAIR | NAME | SHIFT | NEWSHIFT | S/N | NAME | SHIFT | NEWSHIFT | S/N |
| 0 | 17970055 | 0.510356 | 0.00000 | 18.9599 | 17970057 | 0.00153371 | 0.508822 | 19.0383 |
| 1 | 17970059 | 0.508952 | 0.00140399 | 19.0970 | 17970056 | 0.00193321 | 0.508423 | 19.0562 |
| 2 | 17970058 | 0.508840 | 0.00151598 | 19.0575 | 17970060 | 0.000558374 | 0.509798 | 19.0516 |
| 3 | 17970054 | 0.509625 | 0.000730991 | 18.9341 | 17970053 | 0.00000 | 0.510356 | 18.8602 |