| Red | Green | Blue | |
| z | 17.64 | ||
| znorm | Inf | ||
| sky | -Inf | -Inf | -Inf |
| S/N | 19.6 | 33.9 | 38.6 |
| S/N(c) | 0.0 | 0.0 | 0.0 |
| SN(E/C) |
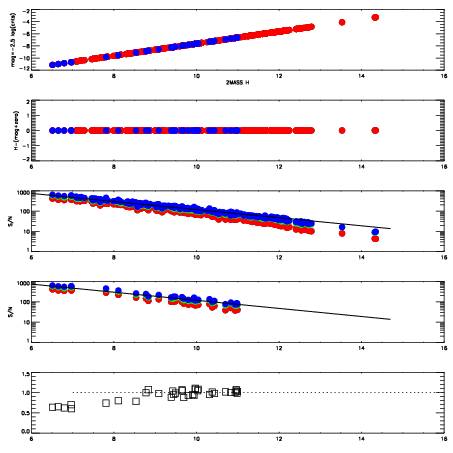
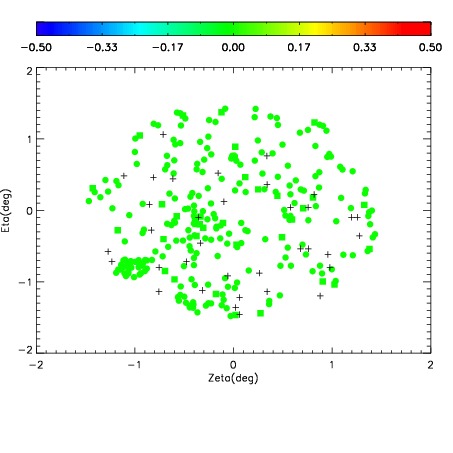
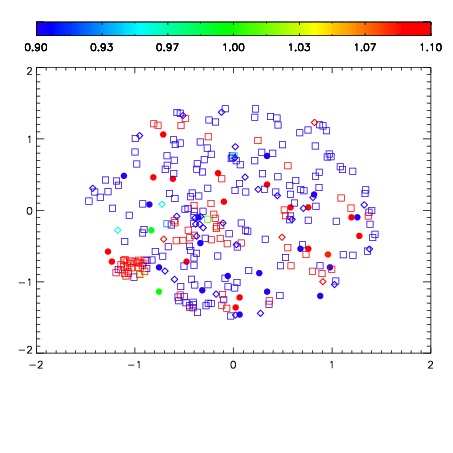
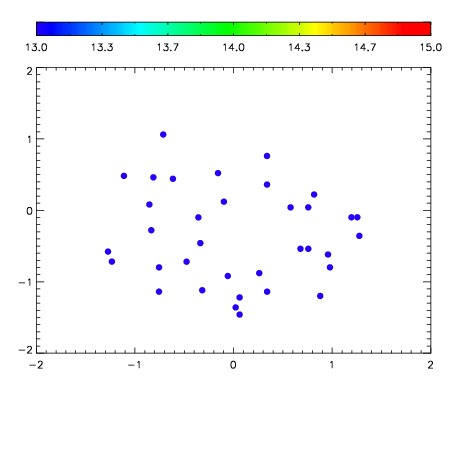

| Frame | Nreads | Zeropoints | Mag plots | Spatial mag deviation | Spatial sky 16325A emission deviations (filled: sky, open: star) | Spatial sky continuum emission | Spatial sky telluric CO2 absorption deviations (filled: H < 10) | |||||||||||||||||||||||
| 0 | 0 |
|
|
|
|
|
|
| IPAIR | NAME | SHIFT | NEWSHIFT | S/N | NAME | SHIFT | NEWSHIFT | S/N |
| 0 | 13810074 | 0.501037 | 0.00000 | 18.4657 | 13810076 | -0.00127098 | 0.502308 | 18.4626 |
| 1 | 13810079 | 0.498774 | 0.00226301 | 18.7480 | 13810080 | -0.00239842 | 0.503435 | 18.8572 |
| 2 | 13810078 | 0.498344 | 0.00269300 | 18.6809 | 13810077 | -0.00166610 | 0.502703 | 18.5911 |
| 3 | 13810075 | 0.500461 | 0.000576019 | 18.4913 | 13810073 | 0.00000 | 0.501037 | 18.4766 |