| Red | Green | Blue | |
| z | 17.64 | ||
| znorm | Inf | ||
| sky | -Inf | -NaN | -NaN |
| S/N | 28.2 | 44.5 | 51.0 |
| S/N(c) | 0.0 | 0.0 | 0.0 |
| SN(E/C) |
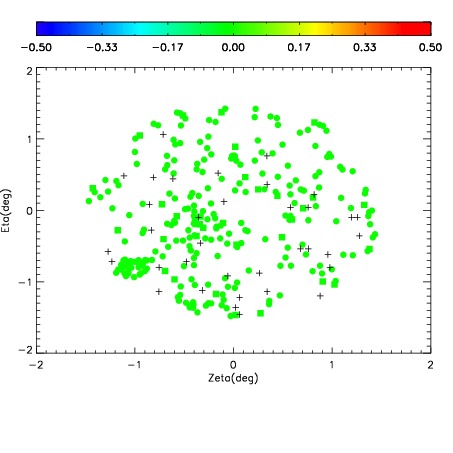
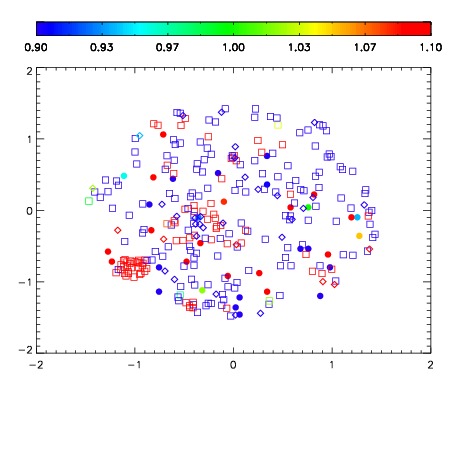


| Frame | Nreads | Zeropoints | Mag plots | Spatial mag deviation | Spatial sky 16325A emission deviations (filled: sky, open: star) | Spatial sky continuum emission | Spatial sky telluric CO2 absorption deviations (filled: H < 10) | |||||||||||||||||||||||
| 0 | 0 |
|
|
|
|
|
|
| IPAIR | NAME | SHIFT | NEWSHIFT | S/N | NAME | SHIFT | NEWSHIFT | S/N |
| 0 | 14090076 | 0.497557 | 0.00000 | 19.1587 | 14090074 | -0.000150627 | 0.497708 | 19.1229 |
| 1 | 14090075 | 0.496485 | 0.00107202 | 19.1733 | 14090077 | -0.000313841 | 0.497871 | 19.1353 |
| 2 | 14090071 | 0.495516 | 0.00204101 | 19.1234 | 14090073 | 0.000680427 | 0.496877 | 19.0907 |
| 3 | 14090072 | 0.496802 | 0.000755012 | 19.1169 | 14090070 | 0.00000 | 0.497557 | 19.0276 |