| Red | Green | Blue | |
| z | 17.64 | ||
| znorm | Inf | ||
| sky | -NaN | -Inf | -NaN |
| S/N | 28.9 | 51.0 | 56.0 |
| S/N(c) | 0.0 | 0.0 | 0.0 |
| SN(E/C) |

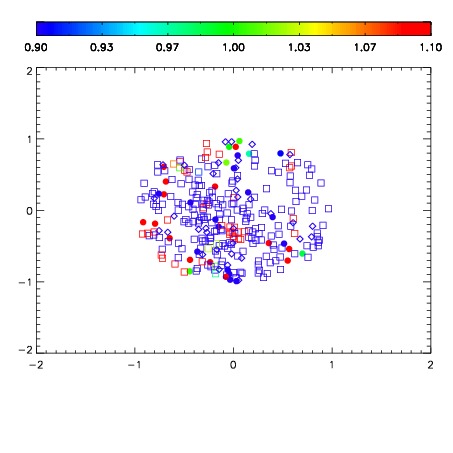


| Frame | Nreads | Zeropoints | Mag plots | Spatial mag deviation | Spatial sky 16325A emission deviations (filled: sky, open: star) | Spatial sky continuum emission | Spatial sky telluric CO2 absorption deviations (filled: H < 10) | |||||||||||||||||||||||
| 0 | 0 |
|
|
|
|
|
|
| IPAIR | NAME | SHIFT | NEWSHIFT | S/N | NAME | SHIFT | NEWSHIFT | S/N |
| 0 | 17330057 | 0.503995 | 0.00000 | 19.0535 | 17330055 | 0.00000 | 0.503995 | 19.0807 |
| 1 | 17330061 | 0.503775 | 0.000220001 | 19.2012 | 17330059 | 0.00135486 | 0.502640 | 19.1506 |
| 2 | 17330060 | 0.503397 | 0.000598013 | 19.1654 | 17330062 | 0.00314846 | 0.500847 | 19.1426 |
| 3 | 17330056 | 0.503467 | 0.000527978 | 19.1089 | 17330058 | 0.00169468 | 0.502300 | 19.1316 |